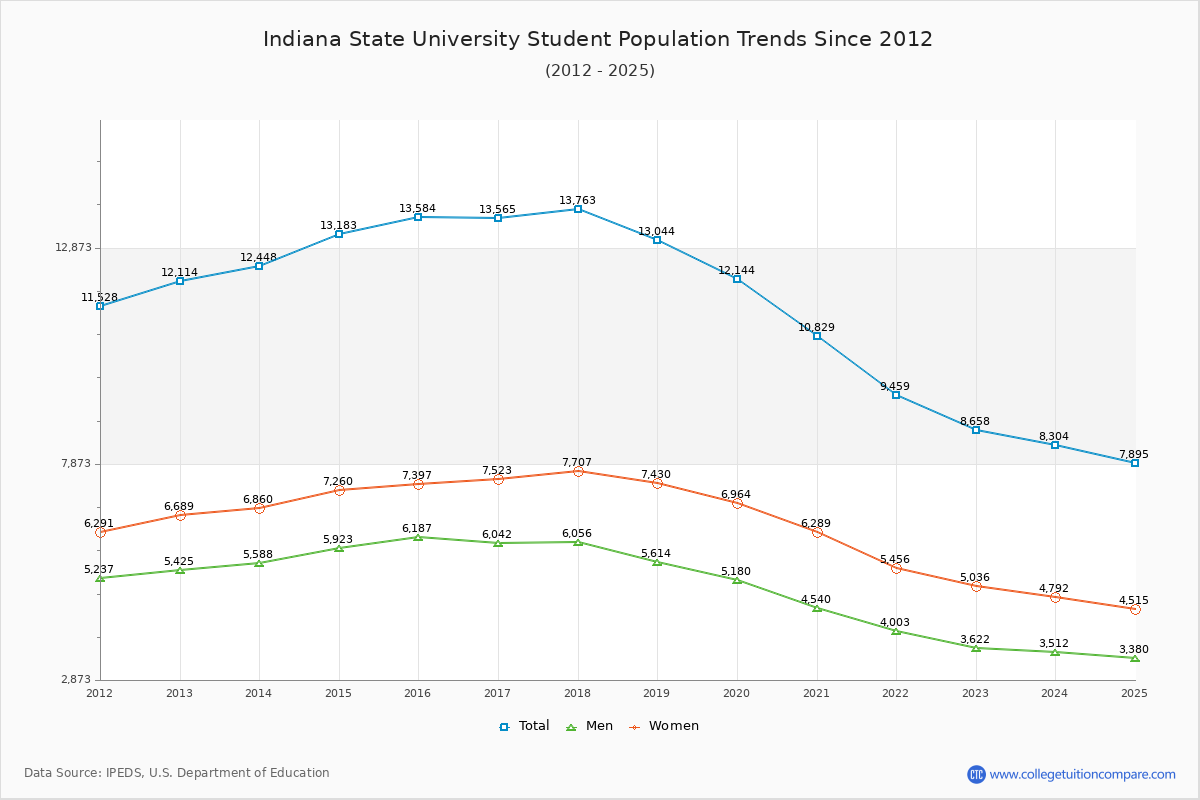
Student Population Changes
The average student population over the last 12 years is 12,072 where 8,658 students are attending the school for the academic year 2022-2023.
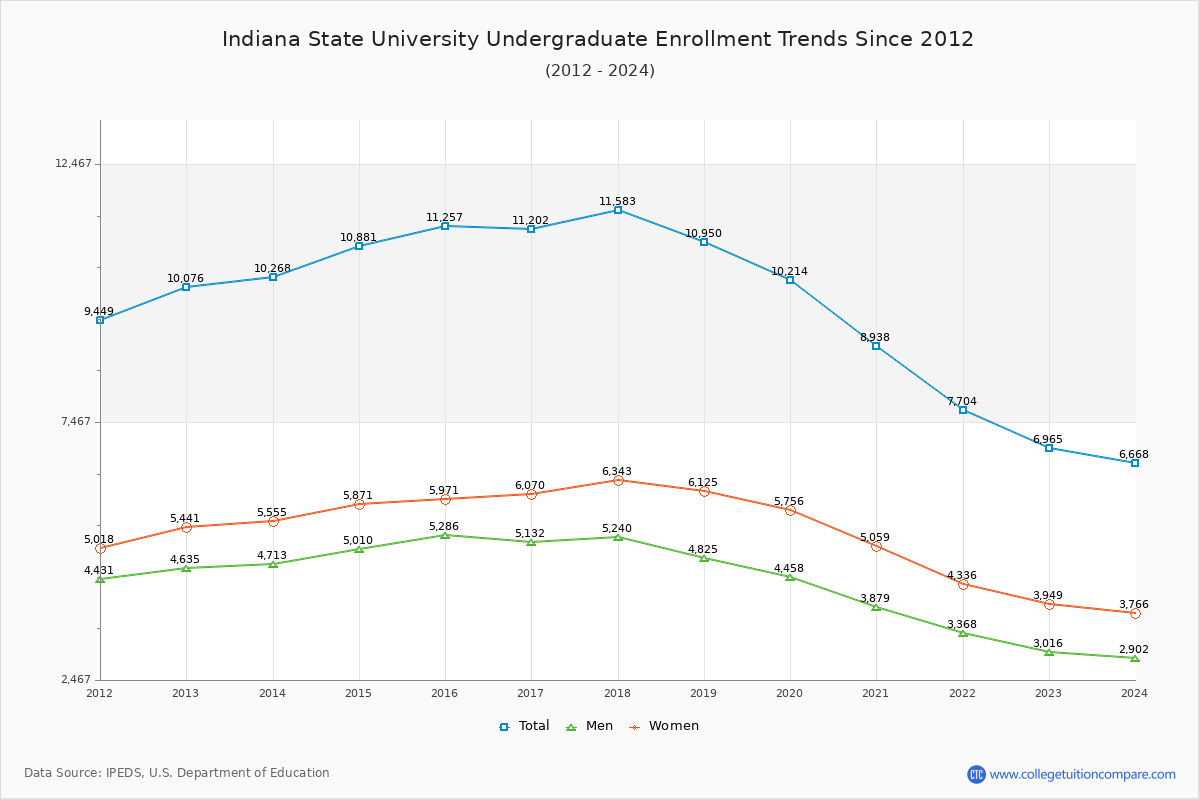
80.45% of total students is undergraduate students and 19.55% students is graduate students. The number of undergraduate students has decreased by 3,111 and the graduate enrollment has decreased by 345 over past 10 years.
The female to male ratio is 1.39 to 1 and it means that there are more female students enrolled in ISU than male students.
The following table and chart illustrate the changes in student population by gender at Indiana State University since 2012.
| Year | Total | Undergraduate | Graduate | ||||
|---|---|---|---|---|---|---|---|
| Total | Men | Women | Total | Men | Women | ||
| 2012-13 | 12,114 | 10,076 | 4,635 | 5,441 | 2,038 | 790 | 1,248 |
| 2013-14 | 12,448 334 | 10,268 192 | 4,713 78 | 5,555 114 | 2,180 142 | 875 85 | 1,305 57 |
| 2014-15 | 13,183 735 | 10,881 613 | 5,010 297 | 5,871 316 | 2,302 122 | 913 38 | 1,389 84 |
| 2015-16 | 13,584 401 | 11,257 376 | 5,286 276 | 5,971 100 | 2,327 25 | 901 -12 | 1,426 37 |
| 2016-17 | 13,565 -19 | 11,202 -55 | 5,132 -154 | 6,070 99 | 2,363 36 | 910 9 | 1,453 27 |
| 2017-18 | 13,763 198 | 11,583 381 | 5,240 108 | 6,343 273 | 2,180 -183 | 816 -94 | 1,364 -89 |
| 2018-19 | 13,044 -719 | 10,950 -633 | 4,825 -415 | 6,125 -218 | 2,094 -86 | 789 -27 | 1,305 -59 |
| 2019-20 | 12,144 -900 | 10,214 -736 | 4,458 -367 | 5,756 -369 | 1,930 -164 | 722 -67 | 1,208 -97 |
| 2020-21 | 10,829 -1,315 | 8,938 -1,276 | 3,879 -579 | 5,059 -697 | 1,891 -39 | 661 -61 | 1,230 22 |
| 2021-22 | 9,459 -1,370 | 7,704 -1,234 | 3,368 -511 | 4,336 -723 | 1,755 -136 | 635 -26 | 1,120 -110 |
| 2022-23 | 8,658 -801 | 6,965 -739 | 3,016 -352 | 3,949 -387 | 1,693 -62 | 606 -29 | 1,087 -33 |
| Average | 12,072 | 10,003 | 4,506 | 5,498 | 2,068 | 783 | 1,285 |