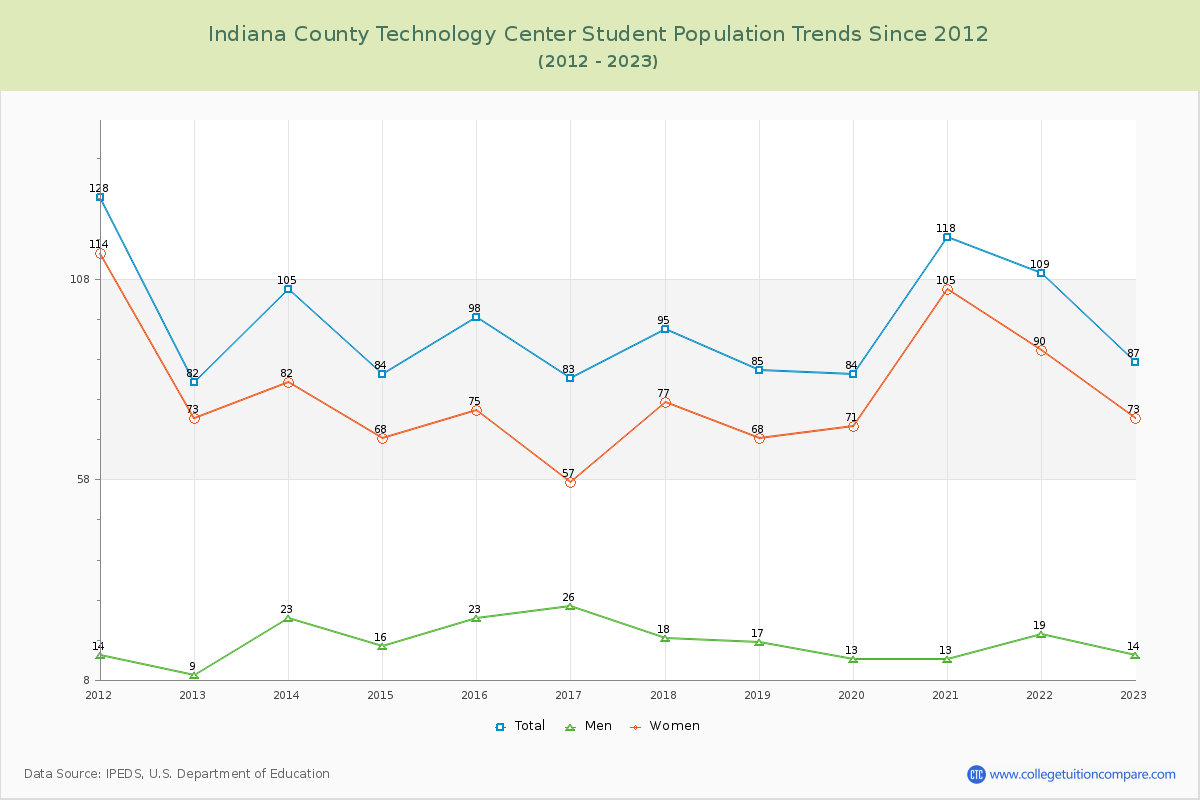
Student Population Changes
The average student population over the last 12 years is 94 where 87 students are attending the school for the academic year 2022-2023.
The female to male ratio is 5.21 to 1 and it means that there are far more female students enrolled in ICTC than male students.
The following table and chart illustrate the changes in student population by gender at Indiana County Technology Center since 2012.
| Year | Total | Men | Women |
|---|---|---|---|
| 2012-13 | 82 | 9 | 73 |
| 2013-14 | 105 23 | 23 14 | 82 9 |
| 2014-15 | 84 -21 | 16 -7 | 68 -14 |
| 2015-16 | 98 14 | 23 7 | 75 7 |
| 2016-17 | 83 -15 | 26 3 | 57 -18 |
| 2017-18 | 95 12 | 18 -8 | 77 20 |
| 2018-19 | 85 -10 | 17 -1 | 68 -9 |
| 2019-20 | 84 -1 | 13 -4 | 71 3 |
| 2020-21 | 118 34 | 13 0 | 105 34 |
| 2021-22 | 109 -9 | 19 6 | 90 -15 |
| 2022-23 | 87 -22 | 14 -5 | 73 -17 |
| Average | 94 | 17 | 76 |