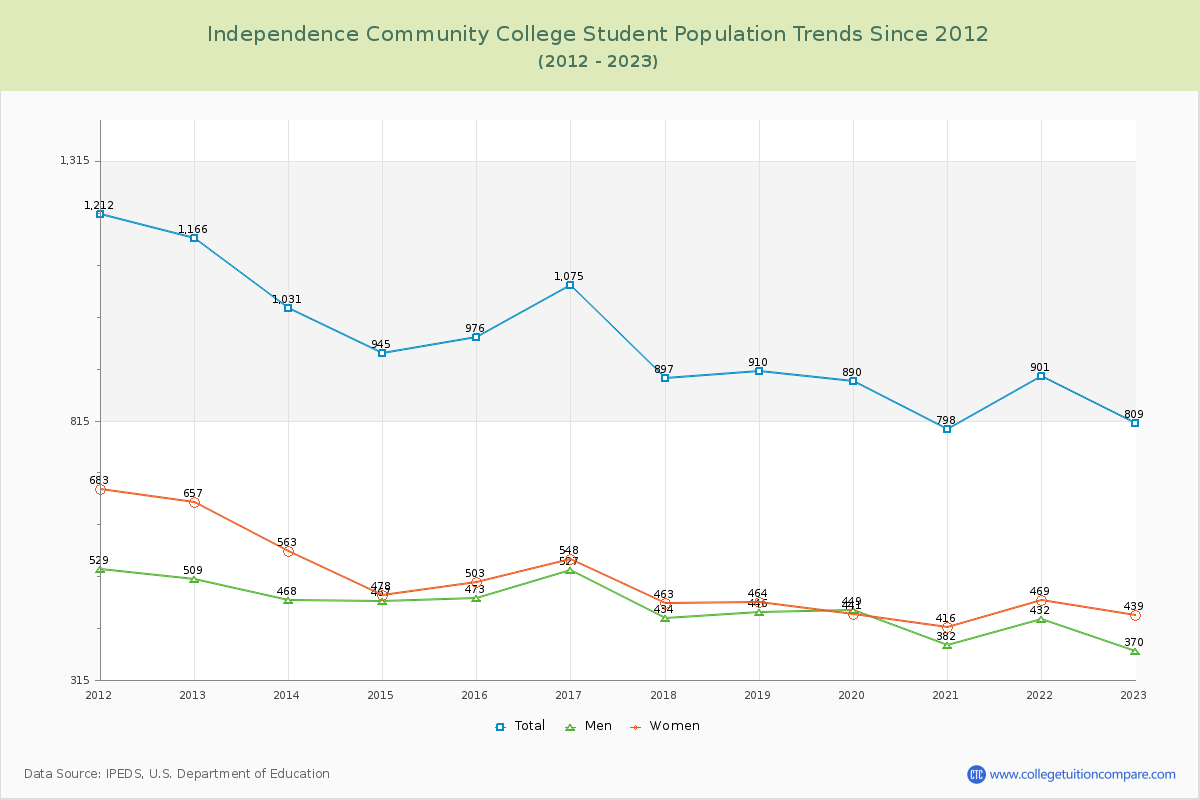
Student Population Changes
The average student population over the last 12 years is 945 where 809 students are attending the school for the academic year 2022-2023.
The female to male ratio is 1.19 to 1 and it means that there are slightly more female students enrolled in Independence CC than male students.
The following table and chart illustrate the changes in student population by gender at Independence Community College since 2012.
| Year | Total | Men | Women |
|---|---|---|---|
| 2012-13 | 1,166 | 509 | 657 |
| 2013-14 | 1,031 -135 | 468 -41 | 563 -94 |
| 2014-15 | 945 -86 | 467 -1 | 478 -85 |
| 2015-16 | 976 31 | 473 6 | 503 25 |
| 2016-17 | 1,075 99 | 527 54 | 548 45 |
| 2017-18 | 897 -178 | 434 -93 | 463 -85 |
| 2018-19 | 910 13 | 446 12 | 464 1 |
| 2019-20 | 890 -20 | 449 3 | 441 -23 |
| 2020-21 | 798 -92 | 382 -67 | 416 -25 |
| 2021-22 | 901 103 | 432 50 | 469 53 |
| 2022-23 | 809 -92 | 370 -62 | 439 -30 |
| Average | 945 | 451 | 495 |