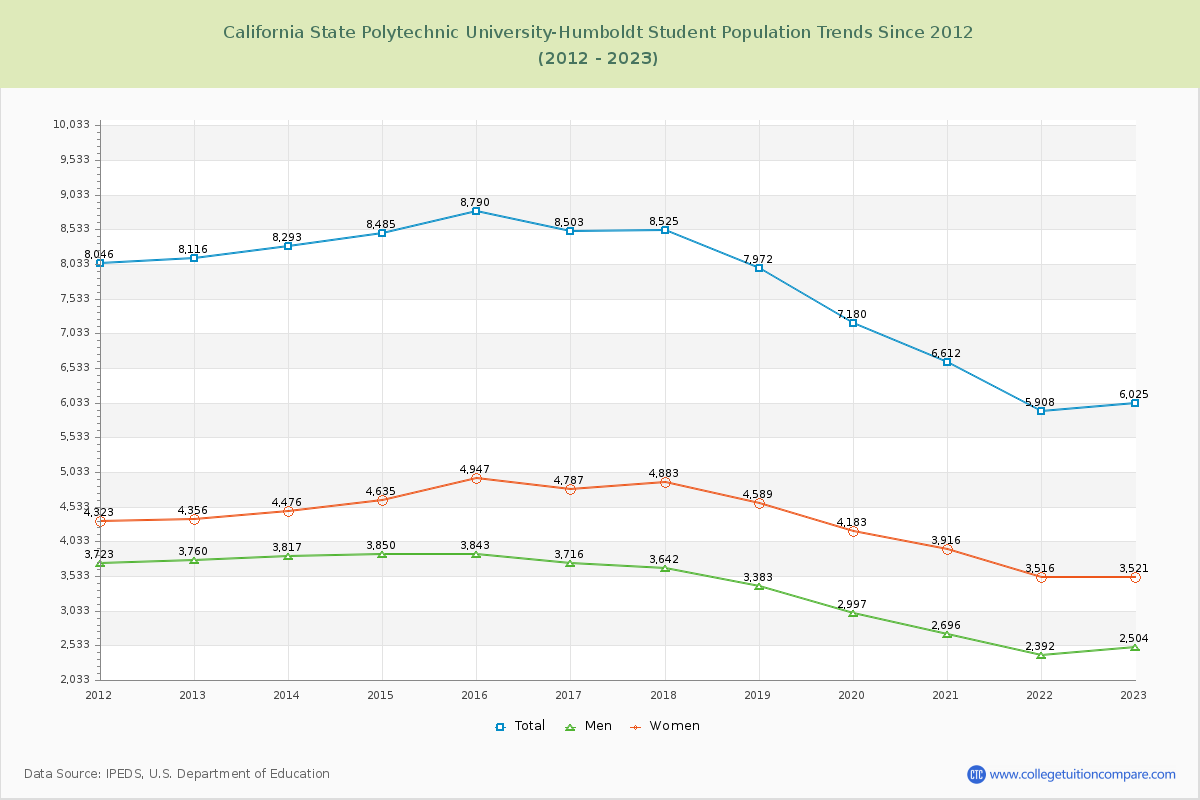
Student Population Changes
The average student population over the last 12 years is 7,674 where 6,025 students are attending the school for the academic year 2022-2023.
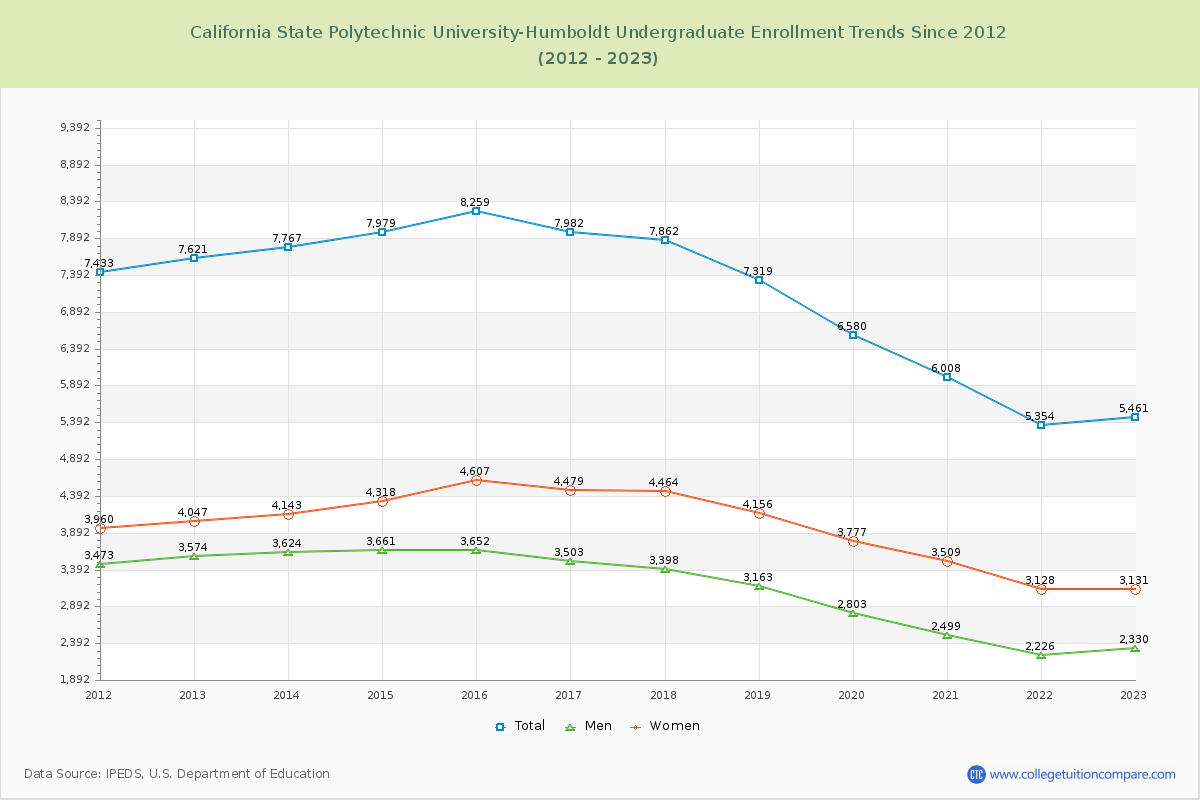
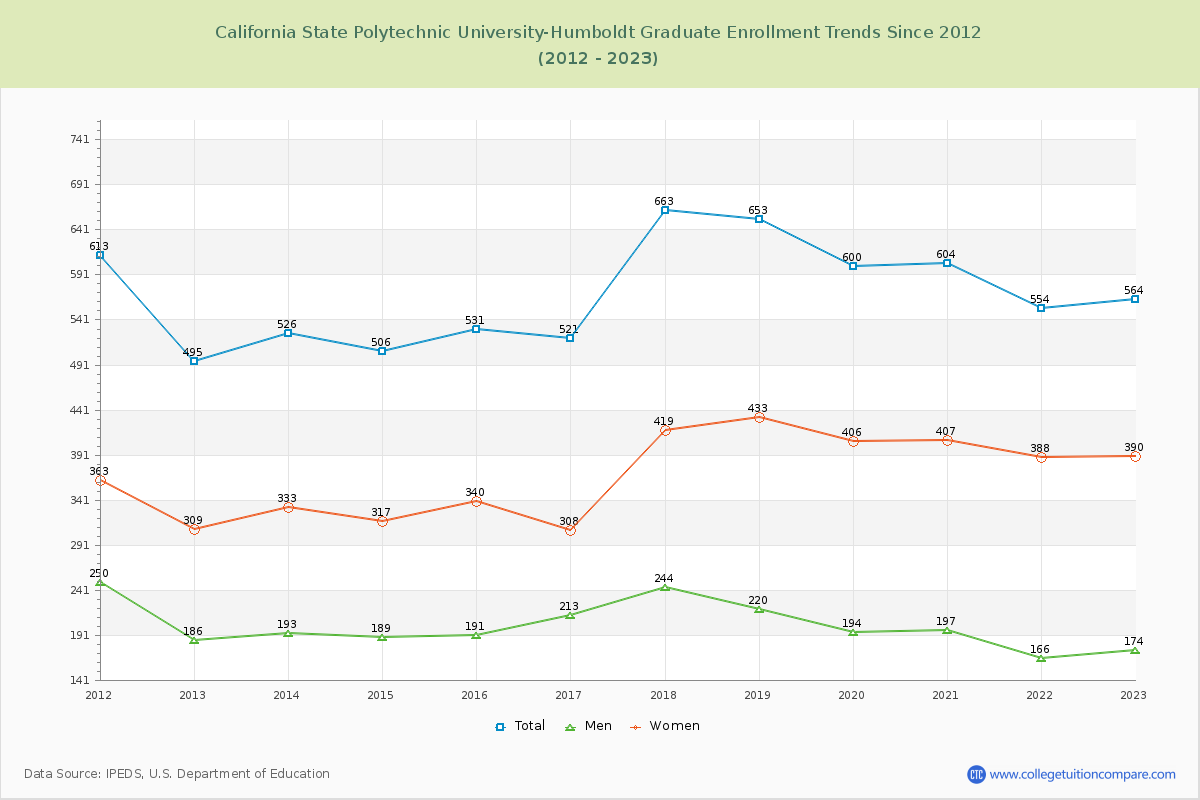
90.64% of total students is undergraduate students and 9.36% students is graduate students. The number of undergraduate students has decreased by 2,160 and the graduate enrollment has increased by 69 over past 10 years.
The female to male ratio is 1.41 to 1 and it means that there are more female students enrolled in Humboldt State than male students.
The following table and chart illustrate the changes in student population by gender at California State Polytechnic University-Humboldt since 2012.
| Year | Total | Undergraduate | Graduate | ||||
|---|---|---|---|---|---|---|---|
| Total | Men | Women | Total | Men | Women | ||
| 2012-13 | 8,116 | 7,621 | 3,574 | 4,047 | 495 | 186 | 309 |
| 2013-14 | 8,293 177 | 7,767 146 | 3,624 50 | 4,143 96 | 526 31 | 193 7 | 333 24 |
| 2014-15 | 8,485 192 | 7,979 212 | 3,661 37 | 4,318 175 | 506 -20 | 189 -4 | 317 -16 |
| 2015-16 | 8,790 305 | 8,259 280 | 3,652 -9 | 4,607 289 | 531 25 | 191 2 | 340 23 |
| 2016-17 | 8,503 -287 | 7,982 -277 | 3,503 -149 | 4,479 -128 | 521 -10 | 213 22 | 308 -32 |
| 2017-18 | 8,525 22 | 7,862 -120 | 3,398 -105 | 4,464 -15 | 663 142 | 244 31 | 419 111 |
| 2018-19 | 7,972 -553 | 7,319 -543 | 3,163 -235 | 4,156 -308 | 653 -10 | 220 -24 | 433 14 |
| 2019-20 | 7,180 -792 | 6,580 -739 | 2,803 -360 | 3,777 -379 | 600 -53 | 194 -26 | 406 -27 |
| 2020-21 | 6,612 -568 | 6,008 -572 | 2,499 -304 | 3,509 -268 | 604 4 | 197 3 | 407 1 |
| 2021-22 | 5,908 -704 | 5,354 -654 | 2,226 -273 | 3,128 -381 | 554 -50 | 166 -31 | 388 -19 |
| 2022-23 | 6,025 117 | 5,461 107 | 2,330 104 | 3,131 3 | 564 10 | 174 8 | 390 2 |
| Average | 7,674 | 7,108 | 3,130 | 3,978 | 565 | 197 | 368 |