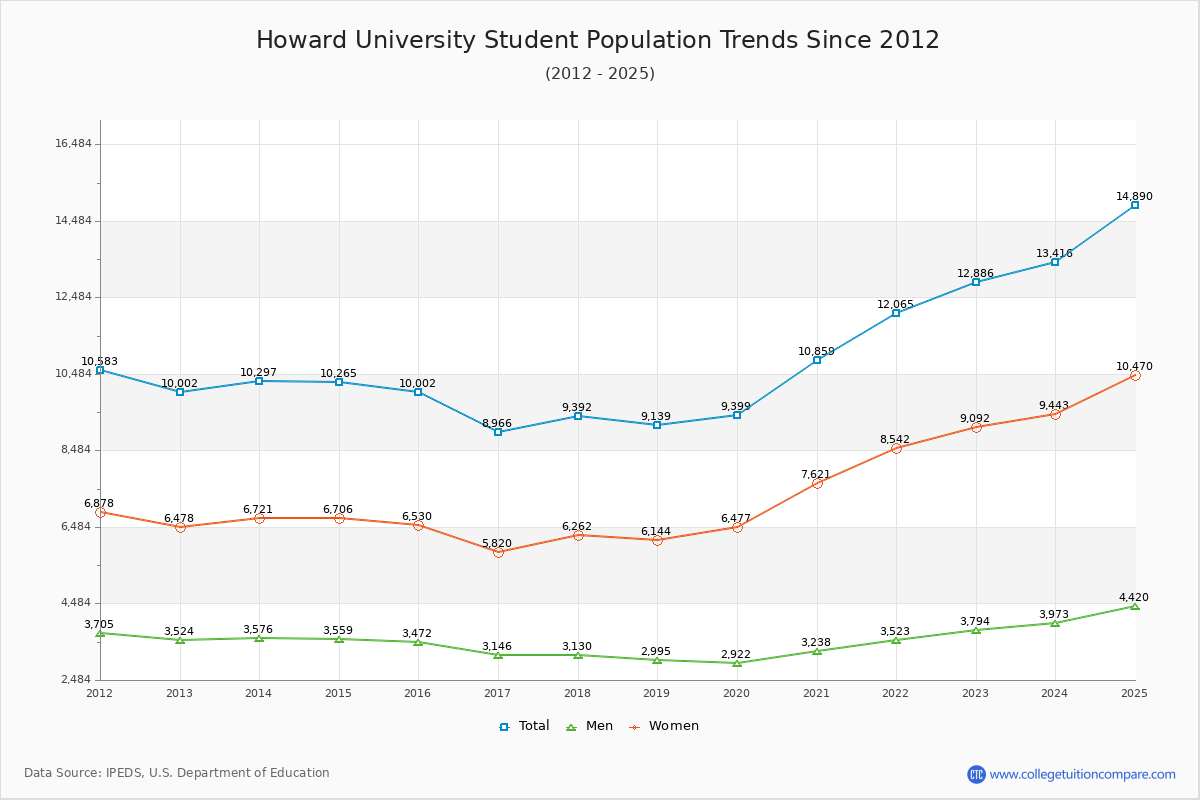
Student Population Changes
The average student population over the last 12 years is 10,297 where 12,886 students are attending the school for the academic year 2022-2023.
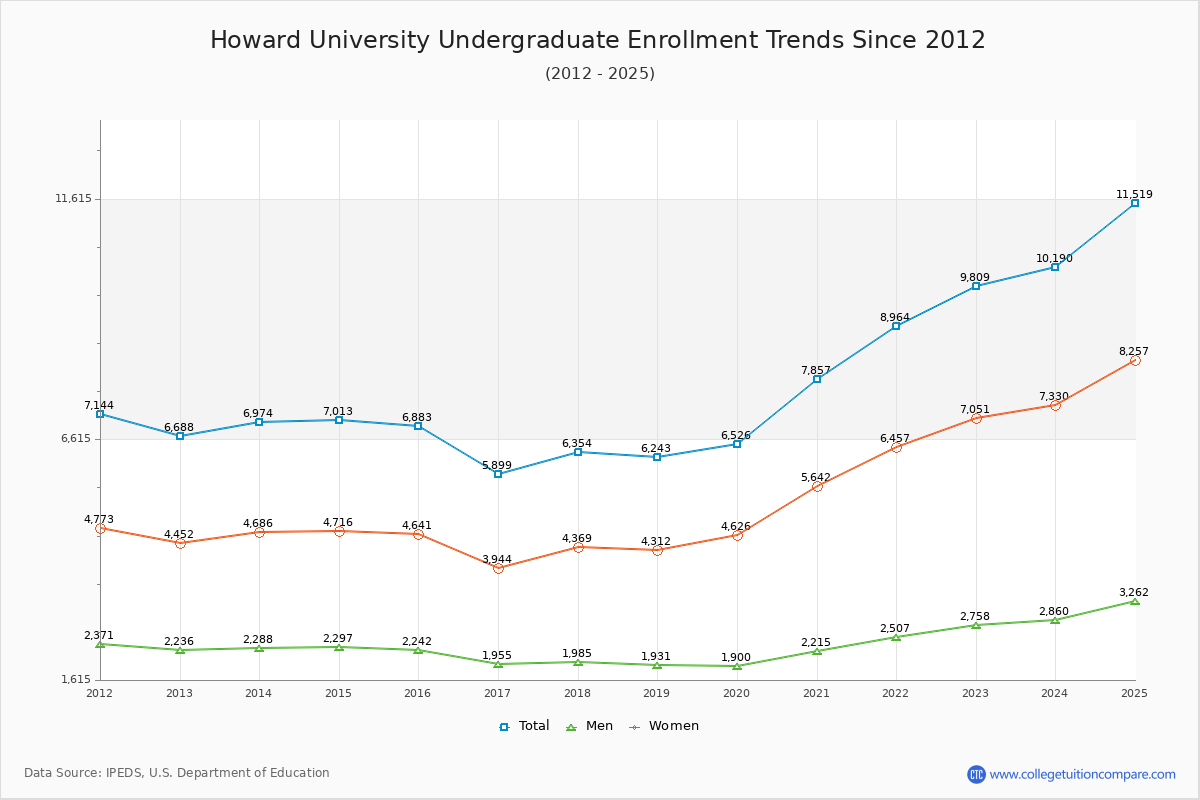
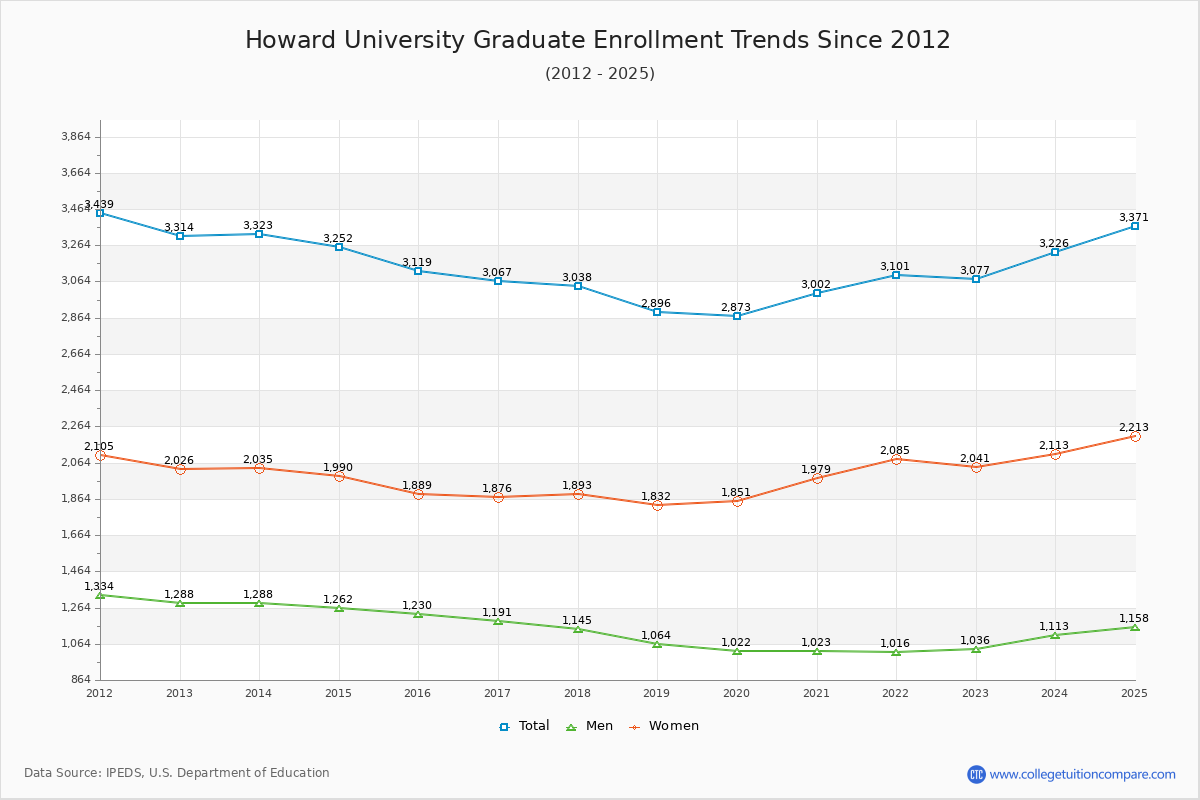
76.12% of total students is undergraduate students and 23.88% students is graduate students. The number of undergraduate students has increased by 3,121 and the graduate enrollment has decreased by 237 over past 10 years.
The female to male ratio is 2.40 to 1 and it means that there are far more female students enrolled in HU than male students.
The following table and chart illustrate the changes in student population by gender at Howard University since 2012.
| Year | Total | Undergraduate | Graduate | ||||
|---|---|---|---|---|---|---|---|
| Total | Men | Women | Total | Men | Women | ||
| 2012-13 | 10,002 | 6,688 | 2,236 | 4,452 | 3,314 | 1,288 | 2,026 |
| 2013-14 | 10,297 295 | 6,974 286 | 2,288 52 | 4,686 234 | 3,323 9 | 1,288 0 | 2,035 9 |
| 2014-15 | 10,265 -32 | 7,013 39 | 2,297 9 | 4,716 30 | 3,252 -71 | 1,262 -26 | 1,990 -45 |
| 2015-16 | 10,002 -263 | 6,883 -130 | 2,242 -55 | 4,641 -75 | 3,119 -133 | 1,230 -32 | 1,889 -101 |
| 2016-17 | 8,966 -1,036 | 5,899 -984 | 1,955 -287 | 3,944 -697 | 3,067 -52 | 1,191 -39 | 1,876 -13 |
| 2017-18 | 9,392 426 | 6,354 455 | 1,985 30 | 4,369 425 | 3,038 -29 | 1,145 -46 | 1,893 17 |
| 2018-19 | 9,139 -253 | 6,243 -111 | 1,931 -54 | 4,312 -57 | 2,896 -142 | 1,064 -81 | 1,832 -61 |
| 2019-20 | 9,399 260 | 6,526 283 | 1,900 -31 | 4,626 314 | 2,873 -23 | 1,022 -42 | 1,851 19 |
| 2020-21 | 10,859 1,460 | 7,857 1,331 | 2,215 315 | 5,642 1,016 | 3,002 129 | 1,023 1 | 1,979 128 |
| 2021-22 | 12,065 1,206 | 8,964 1,107 | 2,507 292 | 6,457 815 | 3,101 99 | 1,016 -7 | 2,085 106 |
| 2022-23 | 12,886 821 | 9,809 845 | 2,758 251 | 7,051 594 | 3,077 -24 | 1,036 20 | 2,041 -44 |
| Average | 10,297 | 7,201 | 2,210 | 4,991 | 3,097 | 1,142 | 1,954 |