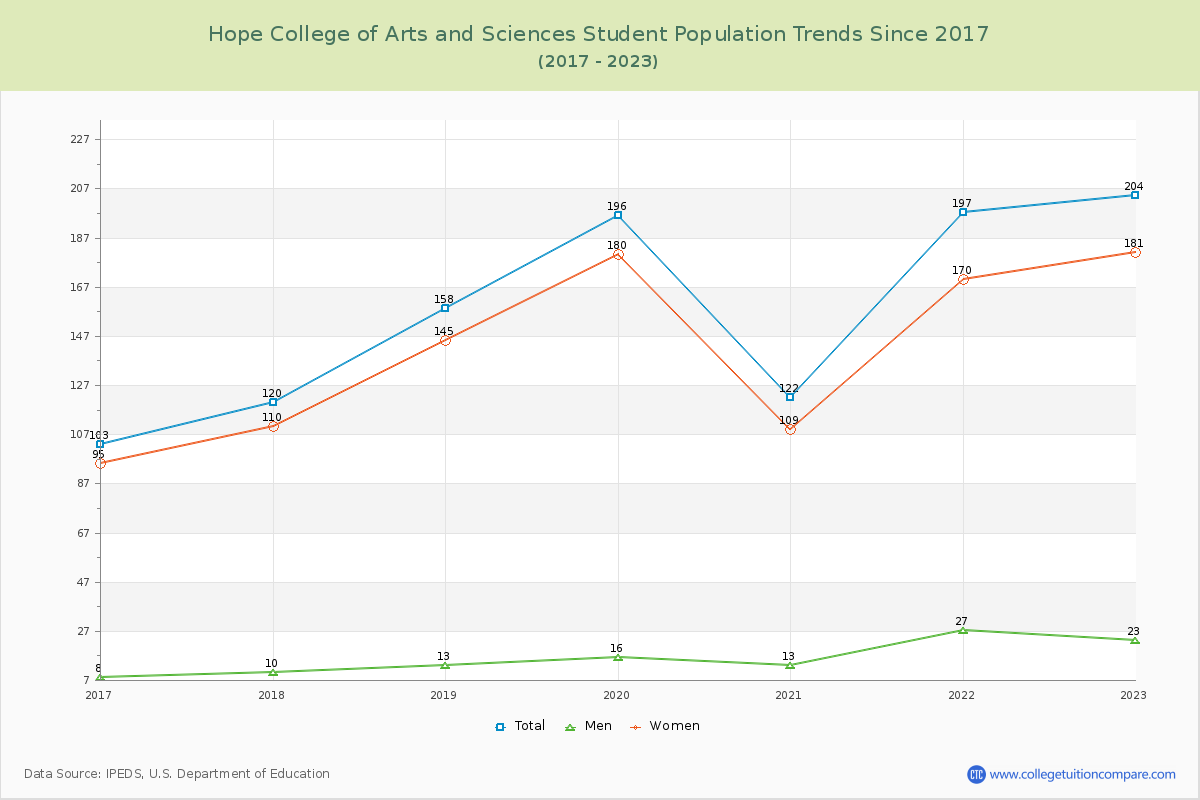
Student Population Changes
The average student population over the last 8 years is 157 where 204 students are attending the school for the academic year 2022-2023.
The female to male ratio is 7.87 to 1 and it means that there are far more female students enrolled in Hope College of Arts and Sciences than male students.
The following table and chart illustrate the changes in student population by gender at Hope College of Arts and Sciences since 2016.
| Year | Total | Men | Women |
|---|---|---|---|
| 2016-17 | 103 | 8 | 95 |
| 2017-18 | 120 17 | 10 2 | 110 15 |
| 2018-19 | 158 38 | 13 3 | 145 35 |
| 2019-20 | 196 38 | 16 3 | 180 35 |
| 2020-21 | 122 -74 | 13 -3 | 109 -71 |
| 2021-22 | 197 75 | 27 14 | 170 61 |
| 2022-23 | 204 7 | 23 -4 | 181 11 |
| Average | 157 | 16 | 141 |