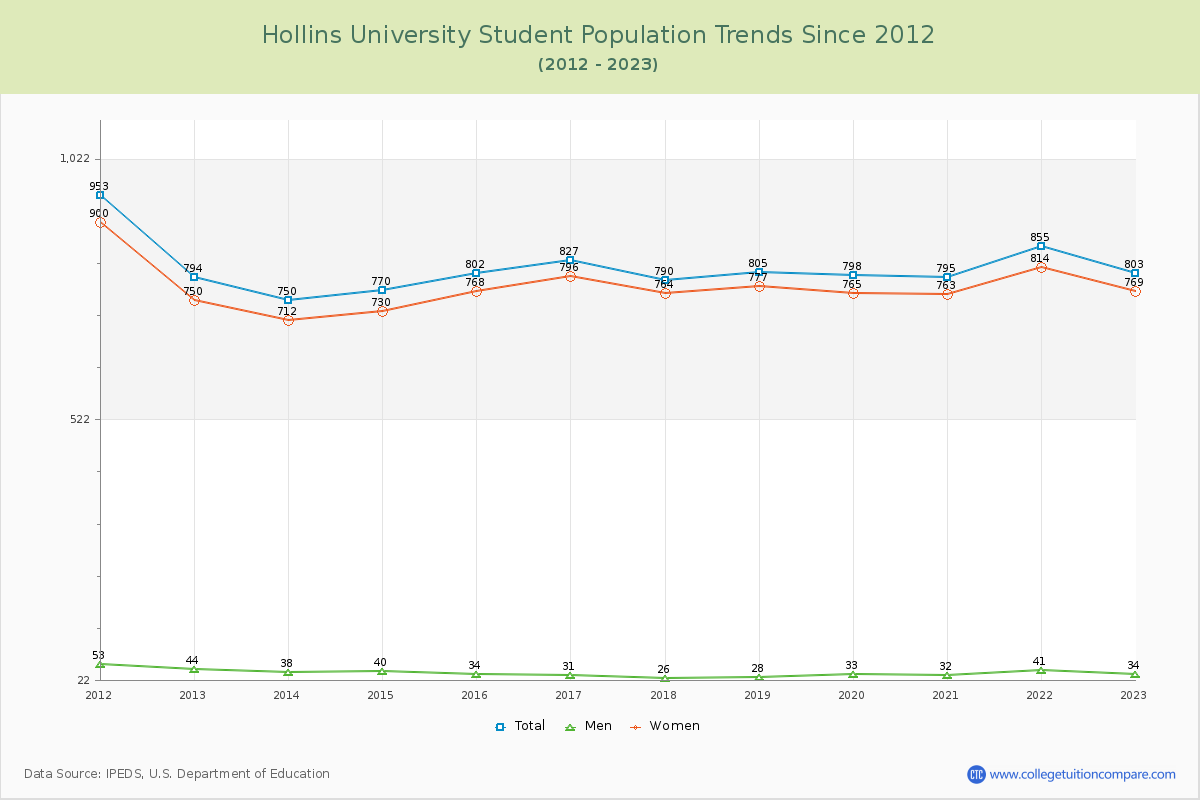
Student Population Changes
The average student population over the last 12 years is 799 where 803 students are attending the school for the academic year 2022-2023.
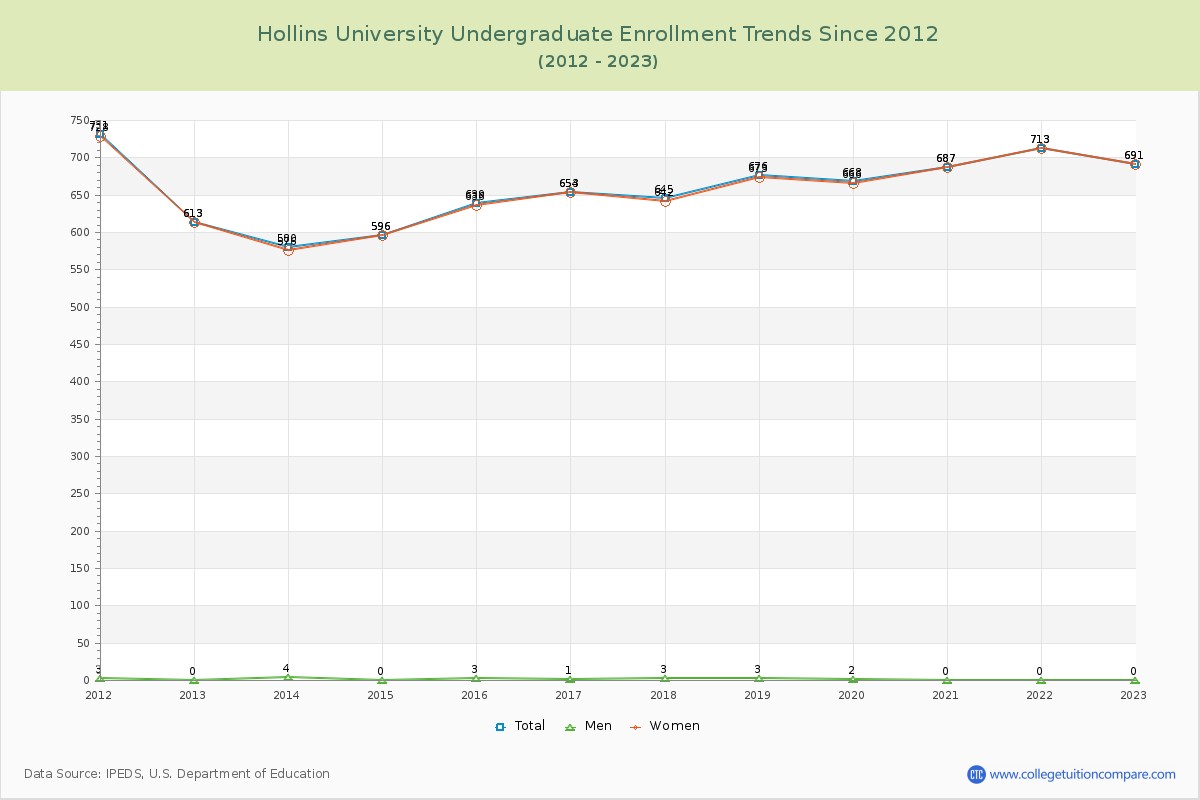
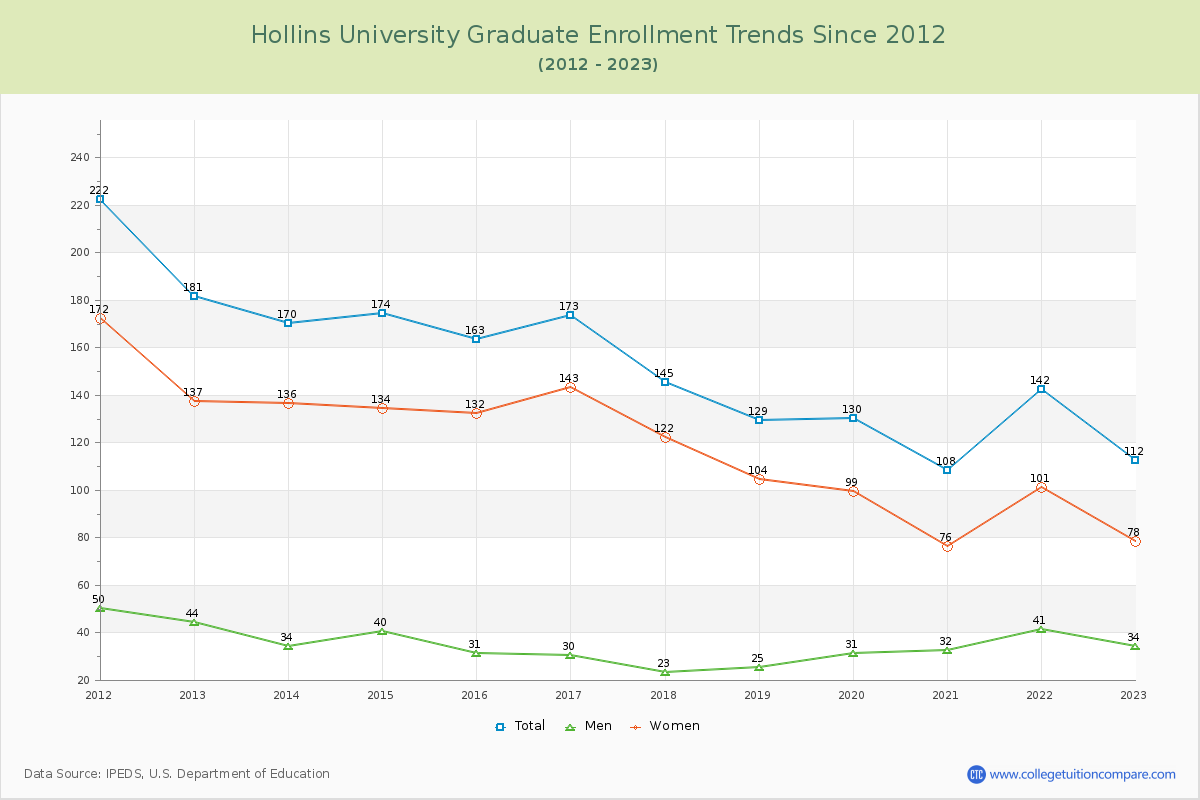
86.05% of total students is undergraduate students and 13.95% students is graduate students. The number of undergraduate students has increased by 78 and the graduate enrollment has decreased by 69 over past 10 years.
The following table and chart illustrate the changes in student population by gender at Hollins University since 2012.
| Year | Total | Undergraduate | Graduate | ||||
|---|---|---|---|---|---|---|---|
| Total | Men | Women | Total | Men | Women | ||
| 2012-13 | 794 | 613 | 0 | 613 | 181 | 44 | 137 |
| 2013-14 | 750 -44 | 580 -33 | 4 4 | 576 -37 | 170 -11 | 34 -10 | 136 -1 |
| 2014-15 | 770 20 | 596 16 | 0 -4 | 596 20 | 174 4 | 40 6 | 134 -2 |
| 2015-16 | 802 32 | 639 43 | 3 3 | 636 40 | 163 -11 | 31 -9 | 132 -2 |
| 2016-17 | 827 25 | 654 15 | 1 -2 | 653 17 | 173 10 | 30 -1 | 143 11 |
| 2017-18 | 790 -37 | 645 -9 | 3 2 | 642 -11 | 145 -28 | 23 -7 | 122 -21 |
| 2018-19 | 805 15 | 676 31 | 3 0 | 673 31 | 129 -16 | 25 2 | 104 -18 |
| 2019-20 | 798 -7 | 668 -8 | 2 -1 | 666 -7 | 130 1 | 31 6 | 99 -5 |
| 2020-21 | 795 -3 | 687 19 | 0 -2 | 687 21 | 108 -22 | 32 1 | 76 -23 |
| 2021-22 | 855 60 | 713 26 | 0 0 | 713 26 | 142 34 | 41 9 | 101 25 |
| 2022-23 | 803 -52 | 691 -22 | 0 0 | 691 -22 | 112 -30 | 34 -7 | 78 -23 |
| Average | 799 | 651 | 1 | 650 | 148 | 33 | 115 |