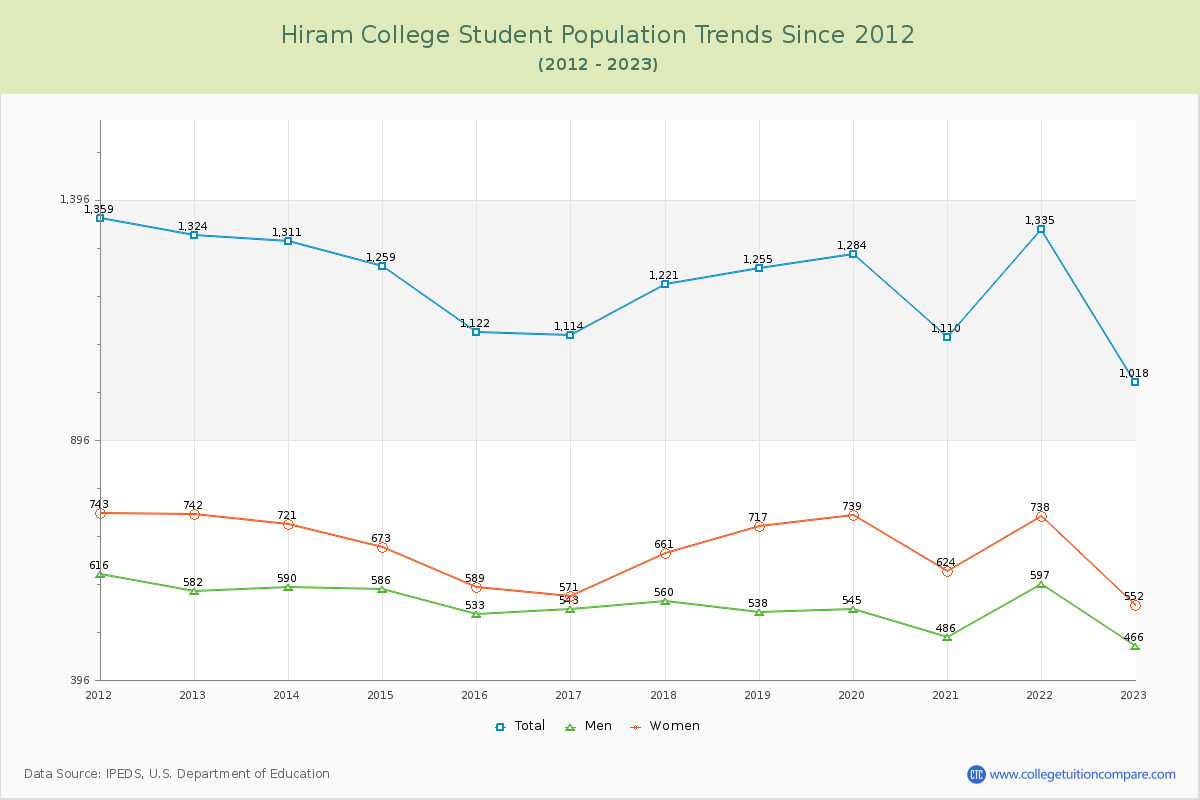
Student Population Changes
The average student population over the last 12 years is 1,214 where 1,018 students are attending the school for the academic year 2022-2023.
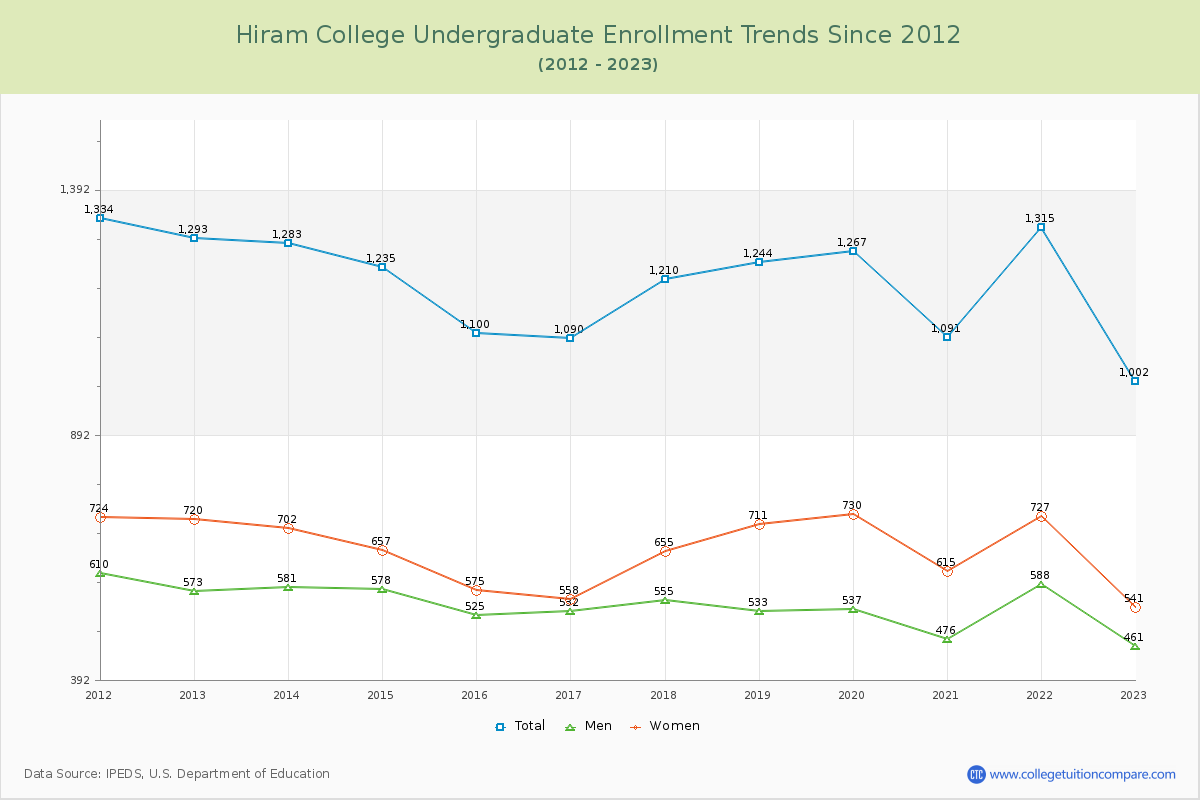
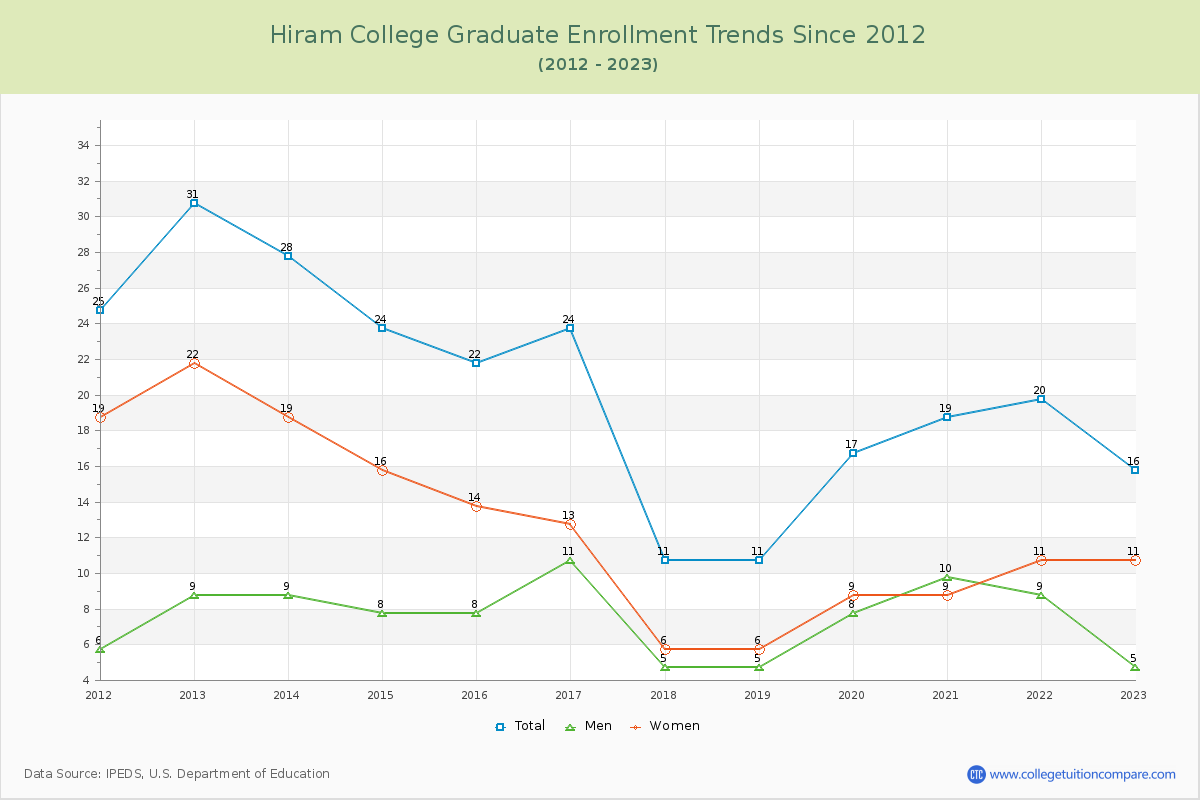
98.43% of total students is undergraduate students and 1.57% students is graduate students. The number of undergraduate students has decreased by 291 and the graduate enrollment has decreased by 15 over past 10 years.
The female to male ratio is 1.18 to 1 and it means that there are slightly more female students enrolled in Hiram than male students.
The following table and chart illustrate the changes in student population by gender at Hiram College since 2012.
| Year | Total | Undergraduate | Graduate | ||||
|---|---|---|---|---|---|---|---|
| Total | Men | Women | Total | Men | Women | ||
| 2012-13 | 1,324 | 1,293 | 573 | 720 | 31 | 9 | 22 |
| 2013-14 | 1,311 -13 | 1,283 -10 | 581 8 | 702 -18 | 28 -3 | 9 0 | 19 -3 |
| 2014-15 | 1,259 -52 | 1,235 -48 | 578 -3 | 657 -45 | 24 -4 | 8 -1 | 16 -3 |
| 2015-16 | 1,122 -137 | 1,100 -135 | 525 -53 | 575 -82 | 22 -2 | 8 0 | 14 -2 |
| 2016-17 | 1,114 -8 | 1,090 -10 | 532 7 | 558 -17 | 24 2 | 11 3 | 13 -1 |
| 2017-18 | 1,221 107 | 1,210 120 | 555 23 | 655 97 | 11 -13 | 5 -6 | 6 -7 |
| 2018-19 | 1,255 34 | 1,244 34 | 533 -22 | 711 56 | 11 0 | 5 0 | 6 0 |
| 2019-20 | 1,284 29 | 1,267 23 | 537 4 | 730 19 | 17 6 | 8 3 | 9 3 |
| 2020-21 | 1,110 -174 | 1,091 -176 | 476 -61 | 615 -115 | 19 2 | 10 2 | 9 0 |
| 2021-22 | 1,335 225 | 1,315 224 | 588 112 | 727 112 | 20 1 | 9 -1 | 11 2 |
| 2022-23 | 1,018 -317 | 1,002 -313 | 461 -127 | 541 -186 | 16 -4 | 5 -4 | 11 0 |
| Average | 1,214 | 1,194 | 540 | 654 | 20 | 8 | 12 |