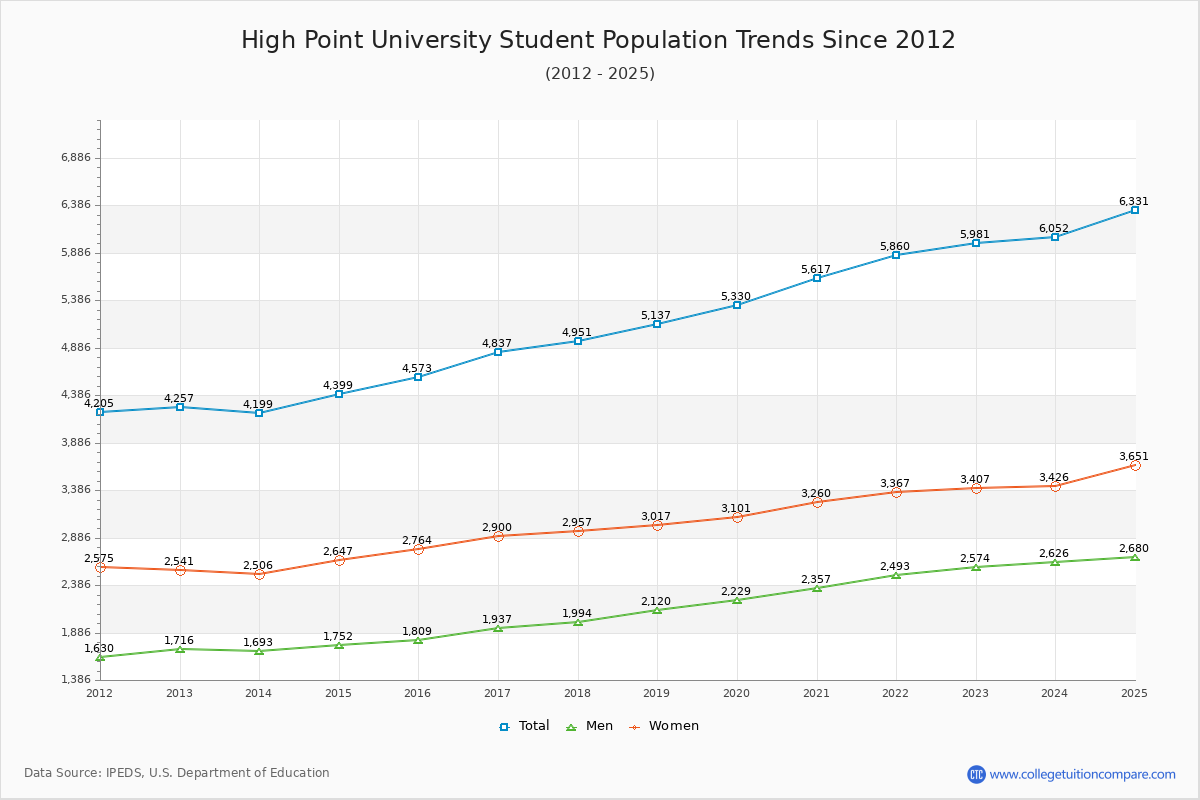
Student Population Changes
The average student population over the last 12 years is 5,013 where 5,981 students are attending the school for the academic year 2022-2023.
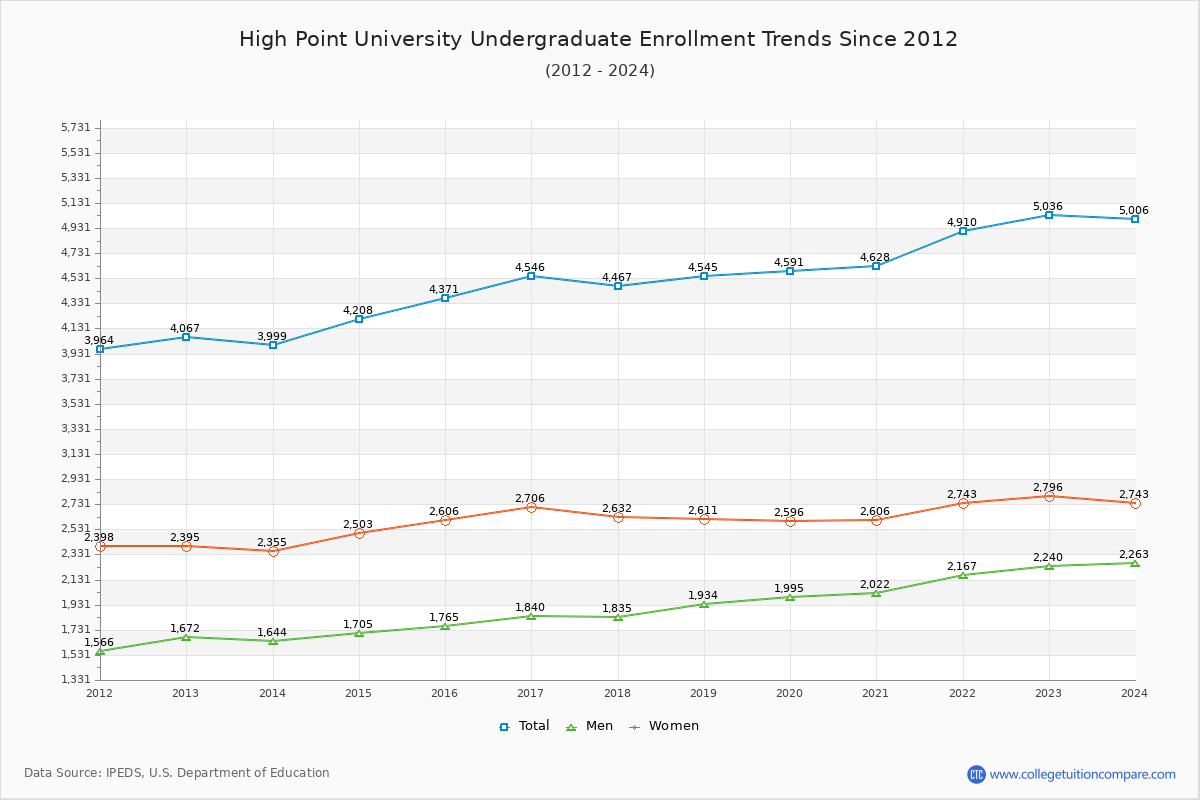
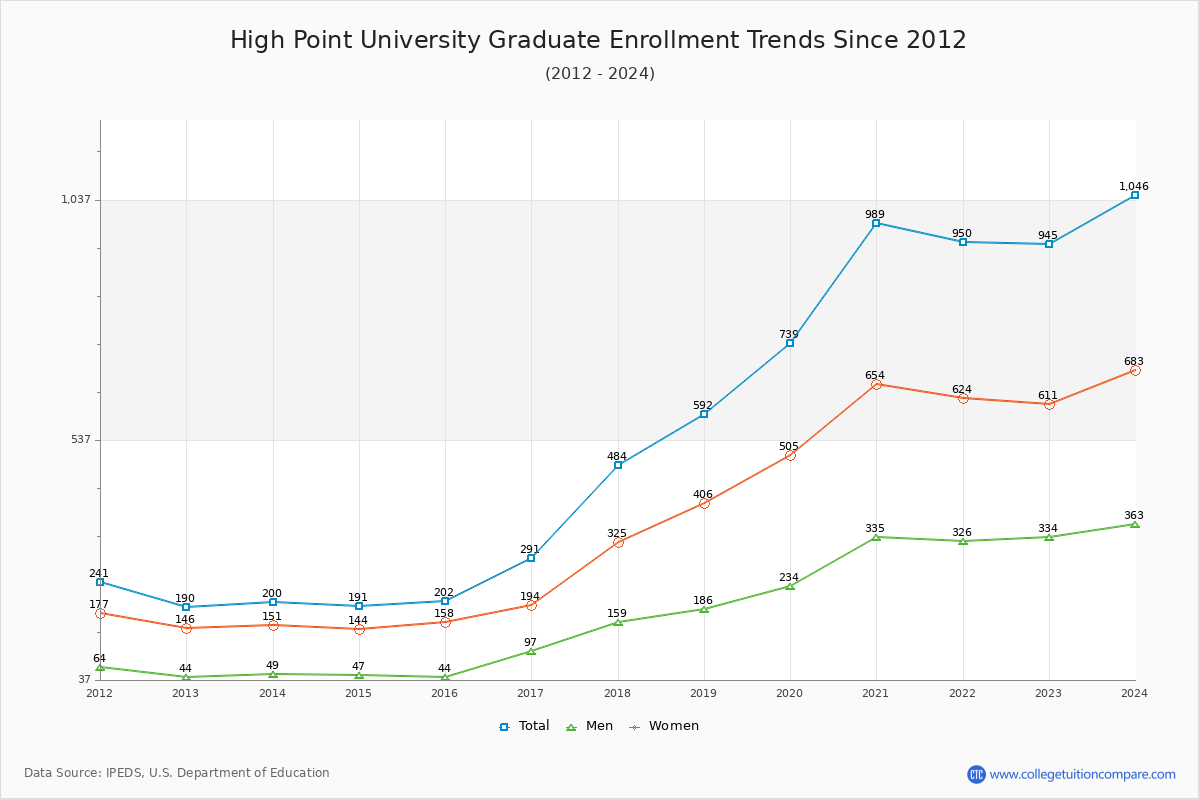
84.20% of total students is undergraduate students and 15.80% students is graduate students. The number of undergraduate students has increased by 969 and the graduate enrollment has increased by 755 over past 10 years.
The female to male ratio is 1.32 to 1 and it means that there are more female students enrolled in HPU than male students.
The following table and chart illustrate the changes in student population by gender at High Point University since 2012.
| Year | Total | Undergraduate | Graduate | ||||
|---|---|---|---|---|---|---|---|
| Total | Men | Women | Total | Men | Women | ||
| 2012-13 | 4,257 | 4,067 | 1,672 | 2,395 | 190 | 44 | 146 |
| 2013-14 | 4,199 -58 | 3,999 -68 | 1,644 -28 | 2,355 -40 | 200 10 | 49 5 | 151 5 |
| 2014-15 | 4,399 200 | 4,208 209 | 1,705 61 | 2,503 148 | 191 -9 | 47 -2 | 144 -7 |
| 2015-16 | 4,573 174 | 4,371 163 | 1,765 60 | 2,606 103 | 202 11 | 44 -3 | 158 14 |
| 2016-17 | 4,837 264 | 4,546 175 | 1,840 75 | 2,706 100 | 291 89 | 97 53 | 194 36 |
| 2017-18 | 4,951 114 | 4,467 -79 | 1,835 -5 | 2,632 -74 | 484 193 | 159 62 | 325 131 |
| 2018-19 | 5,137 186 | 4,545 78 | 1,934 99 | 2,611 -21 | 592 108 | 186 27 | 406 81 |
| 2019-20 | 5,330 193 | 4,591 46 | 1,995 61 | 2,596 -15 | 739 147 | 234 48 | 505 99 |
| 2020-21 | 5,617 287 | 4,628 37 | 2,022 27 | 2,606 10 | 989 250 | 335 101 | 654 149 |
| 2021-22 | 5,860 243 | 4,910 282 | 2,167 145 | 2,743 137 | 950 -39 | 326 -9 | 624 -30 |
| 2022-23 | 5,981 121 | 5,036 126 | 2,240 73 | 2,796 53 | 945 -5 | 334 8 | 611 -13 |
| Average | 5,013 | 4,488 | 1,893 | 2,595 | 525 | 169 | 356 |