Student Population Changes
The average student population over the last 12 years is 371 where 394 students are attending the school for the academic year 2022-2023.
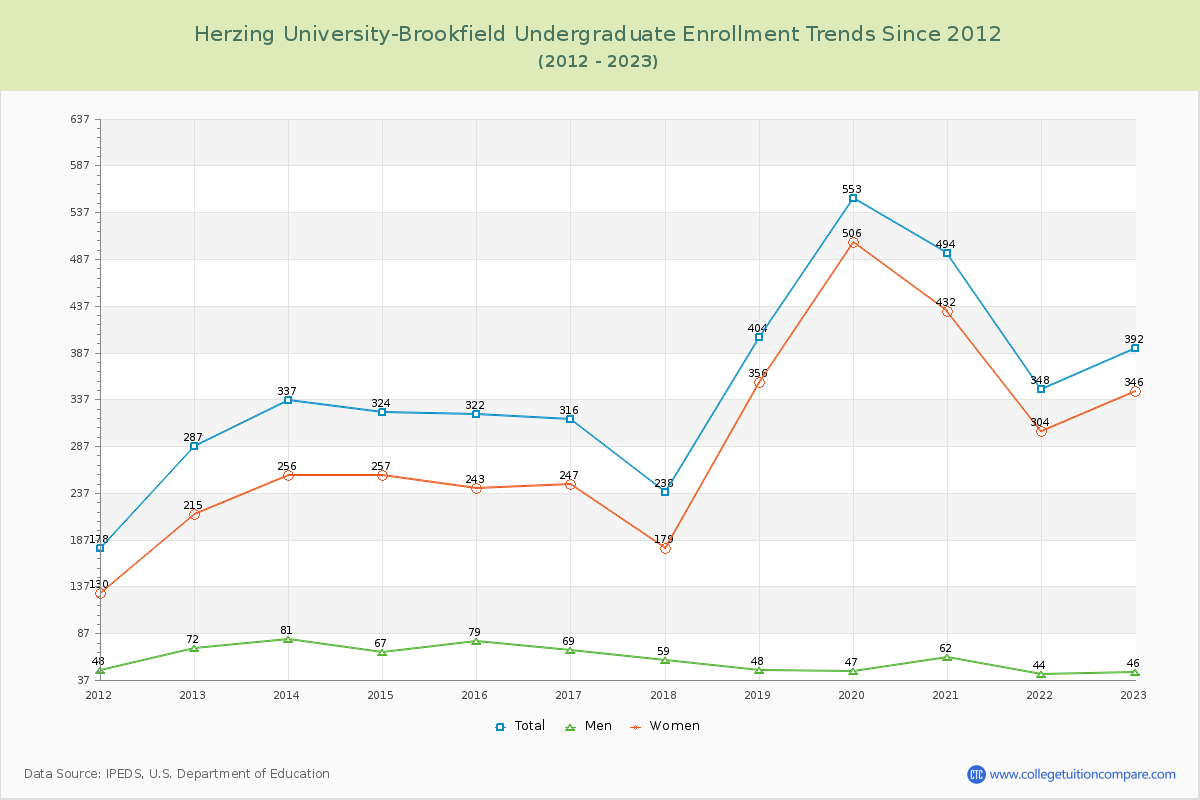
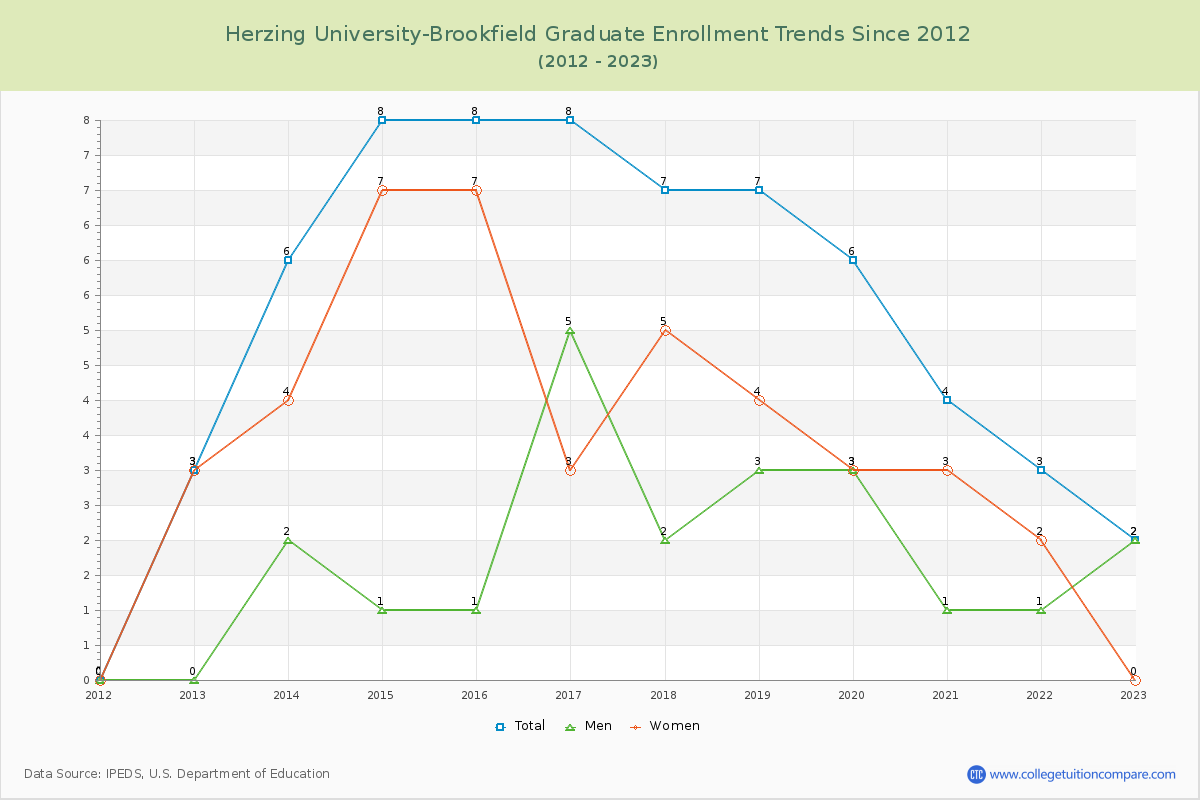
99.49% of total students is undergraduate students and 0.51% students is graduate students. The number of undergraduate students has increased by 105 and the graduate enrollment has decreased by 1 over past 10 years.
The female to male ratio is 7.21 to 1 and it means that there are far more female students enrolled in Herzing University-Brookfield than male students.
The following table and chart illustrate the changes in student population by gender at Herzing University-Brookfield since 2012.
| Year | Total | Undergraduate | Graduate | ||||
|---|---|---|---|---|---|---|---|
| Total | Men | Women | Total | Men | Women | ||
| 2012-13 | 290 | 287 | 72 | 215 | 3 | 0 | 3 |
| 2013-14 | 343 53 | 337 50 | 81 9 | 256 41 | 6 3 | 2 2 | 4 1 |
| 2014-15 | 332 -11 | 324 -13 | 67 -14 | 257 1 | 8 2 | 1 -1 | 7 3 |
| 2015-16 | 330 -2 | 322 -2 | 79 12 | 243 -14 | 8 0 | 1 0 | 7 0 |
| 2016-17 | 324 -6 | 316 -6 | 69 -10 | 247 4 | 8 0 | 5 4 | 3 -4 |
| 2017-18 | 245 -79 | 238 -78 | 59 -10 | 179 -68 | 7 -1 | 2 -3 | 5 2 |
| 2018-19 | 411 166 | 404 166 | 48 -11 | 356 177 | 7 0 | 3 1 | 4 -1 |
| 2019-20 | 559 148 | 553 149 | 47 -1 | 506 150 | 6 -1 | 3 0 | 3 -1 |
| 2020-21 | 498 -61 | 494 -59 | 62 15 | 432 -74 | 4 -2 | 1 -2 | 3 0 |
| 2021-22 | 351 -147 | 348 -146 | 44 -18 | 304 -128 | 3 -1 | 1 0 | 2 -1 |
| 2022-23 | 394 43 | 392 44 | 46 2 | 346 42 | 2 -1 | 2 1 | 0 -2 |
| Average | 371 | 365 | 61 | 304 | 6 | 2 | 4 |