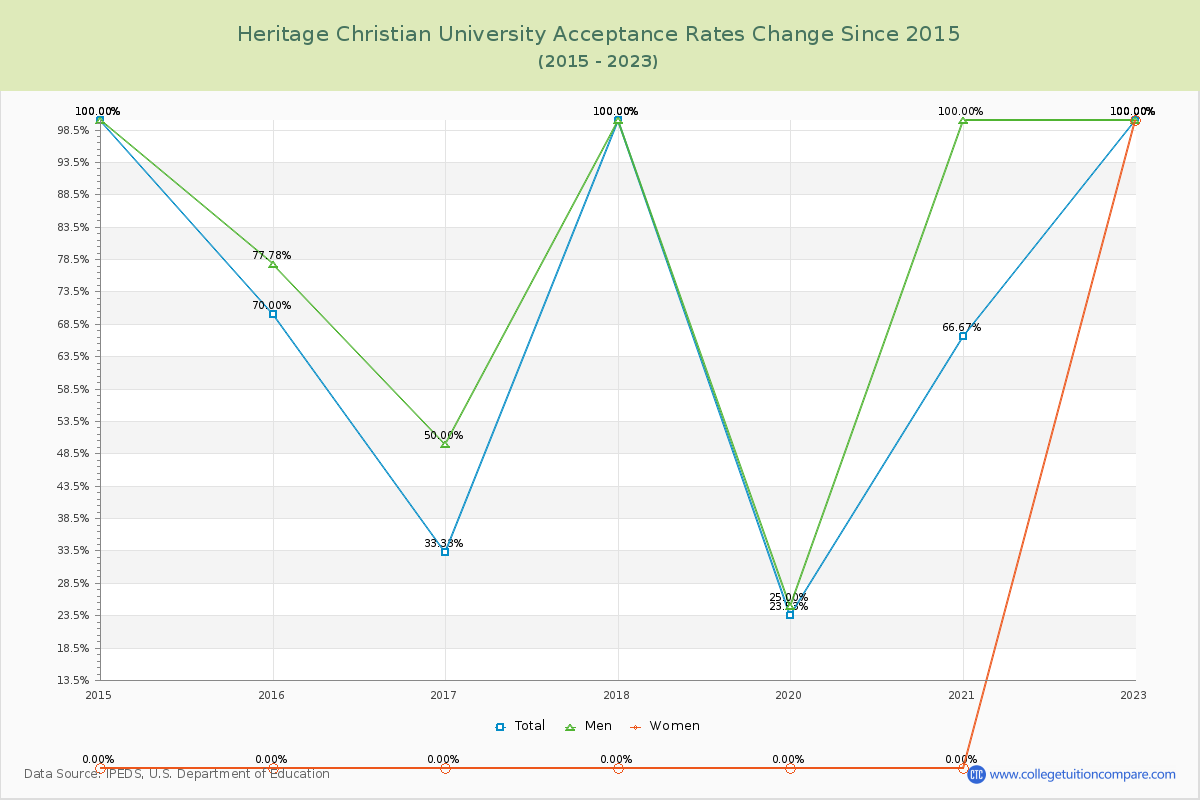
The average acceptance rate over the last 10 years is 54.84%, and this year's acceptance rate is 100.00% at Heritage Christian University. By gender, men students' acceptance rate is 61.42% and women students' rate is 11.11%.
TableInteractive ChartDownloadable Chart
Year
Total
Men
Women
2014-15
100.00%
100.00%
0.00%
2015-16
70.00% -30.00%
77.78% 0.00%
0.00% 0.00%
2016-17
33.33% -36.67%
50.00% 0.00%
0.00% 0.00%
2017-18
100.00% 66.67%
100.00% 0.00%
0.00% 0.00%
2018-19
-
-
-
2019-20
23.53% -
25.00% -
0.00% -
2020-21
66.67% 43.14%
100.00% 0.00%
0.00% 0.00%
2021-22
-
-
-
2022-23
100.00% -
100.00% -
100.00% -
Average
54.84%
61.42%
11.11%
Acceptance Rate Changes of Heritage Christian University
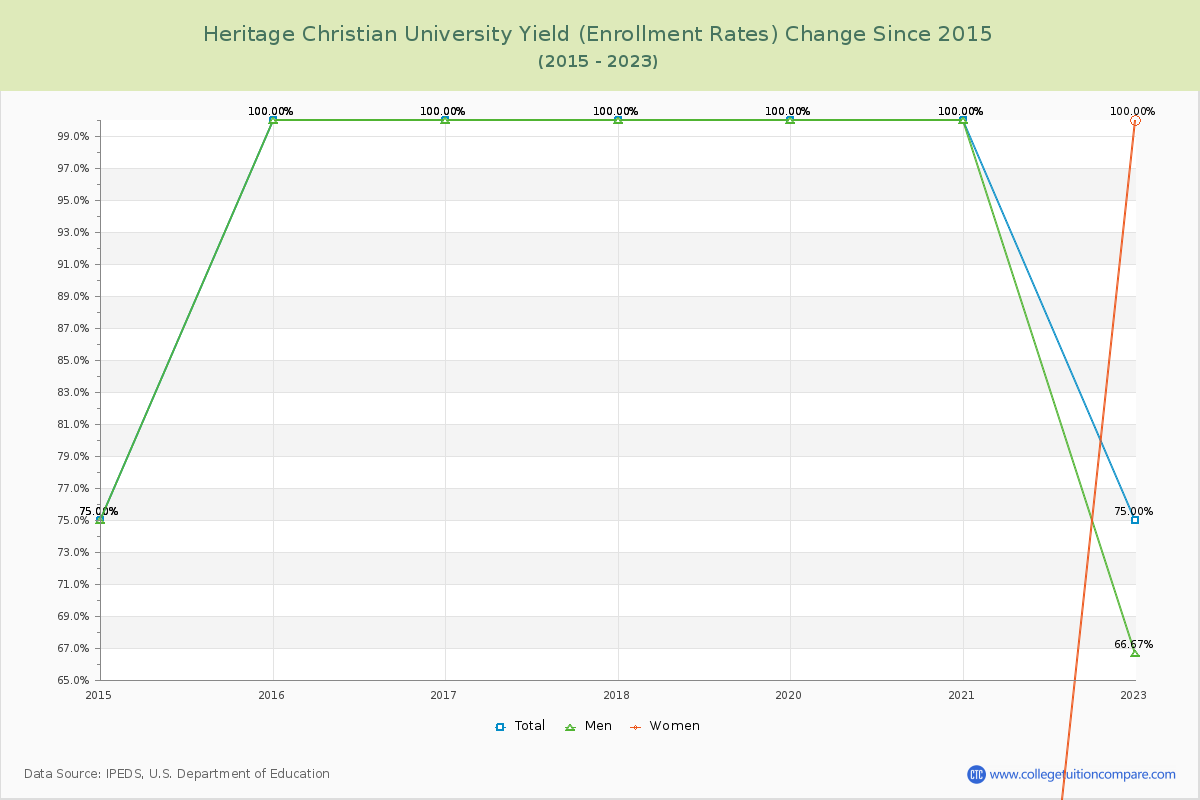
Admission Yield (Enrollment Rate) Changes
The average admission yield of the last 9 years is 72.22% where the current academic year yield is 75.00%.
The following table and chart illustrate the changes in yield at Heritage Christian University from 2014 to 2023.
TableInteractive ChartDownloadable Chart
Year
Total
Men
Women
2014-15
75.00%
75.00%
0.00%
2015-16
100.00% 25.00%
100.00% 0.00%
0.00% 0.00%
2016-17
100.00% 0.00%
100.00% 0.00%
0.00% 0.00%
2017-18
100.00% 0.00%
100.00% 0.00%
0.00% 0.00%
2018-19
-
-
-
2019-20
100.00% -
100.00% -
0.00% -
2020-21
100.00% 0.00%
100.00% 0.00%
0.00% 0.00%
2021-22
-
-
-
2022-23
75.00% -
66.67% -
100.00% -
Average
72.22%
71.30%
11.11%
Admission Yield (Enrollment Rate) Changes of Heritage Christian University
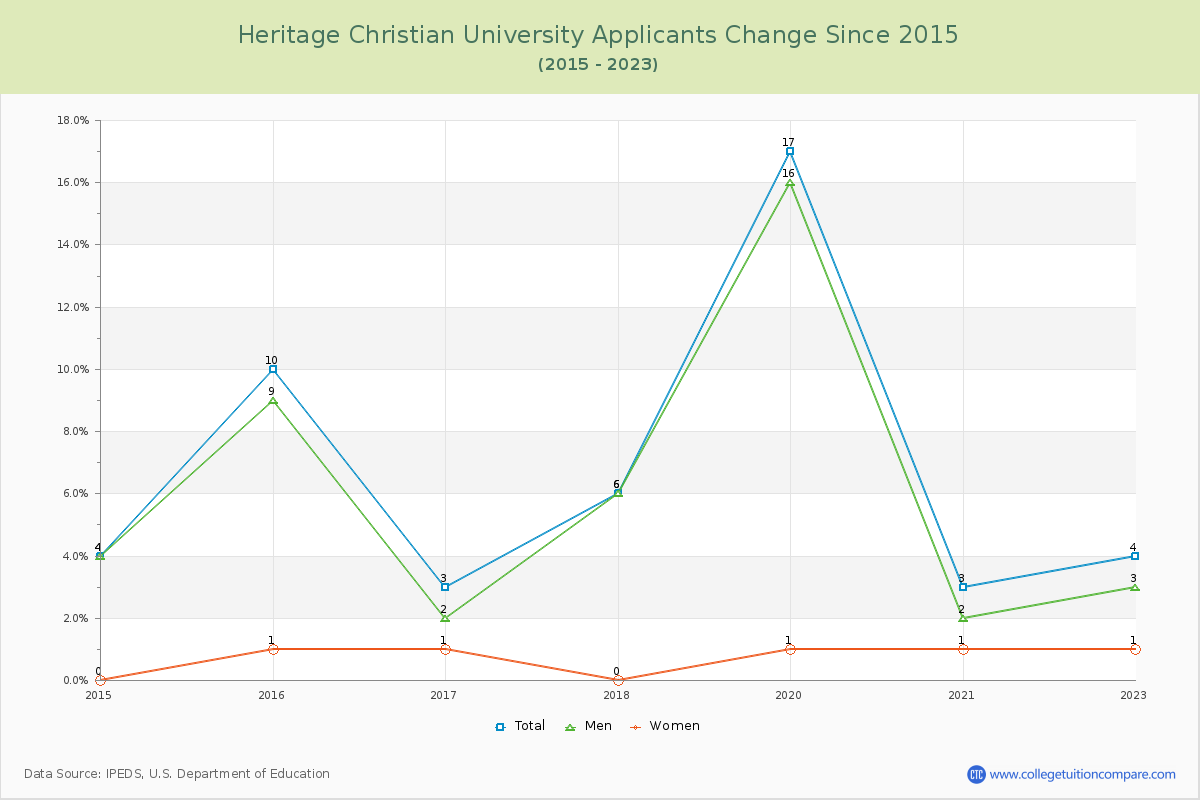
Applicants, Admitted, and Enrolled Headcount Changes
Over the past 10 years, The average number of applicants is 5, the average number of admitted is 3, and the average number of first-year enrolled students is 3.
TableInteractive ChartDownloadable Chart
Year
Applicants
Admitted
Enrolled
2014-15
4
4
3
2015-16
10 6
7 4
7 4
2016-17
3 -7
1 -6
1 -6
2017-18
6 3
6 5
6 5
2018-19
-
-
-
2019-20
17 -
4 -
4 -
2020-21
3 -14
2 -2
2 -2
2021-22
-
-
-
2022-23
4 -
4 -
3 -
Average
5
3
3
Applicants, Admitted, and Enrolled Headcount Changes of Heritage Christian University