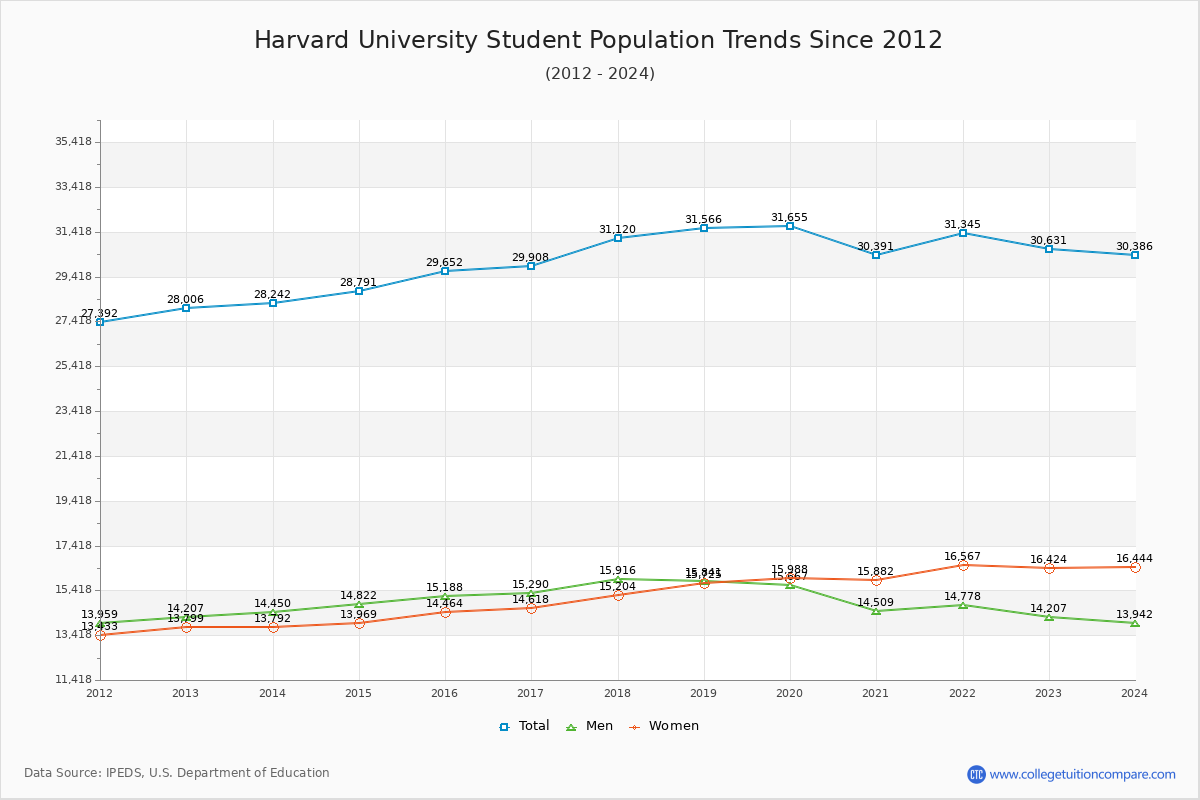
Student Population Changes
The average student population over the last 12 years is 30,119 where 30,631 students are attending the school for the academic year 2022-2023.
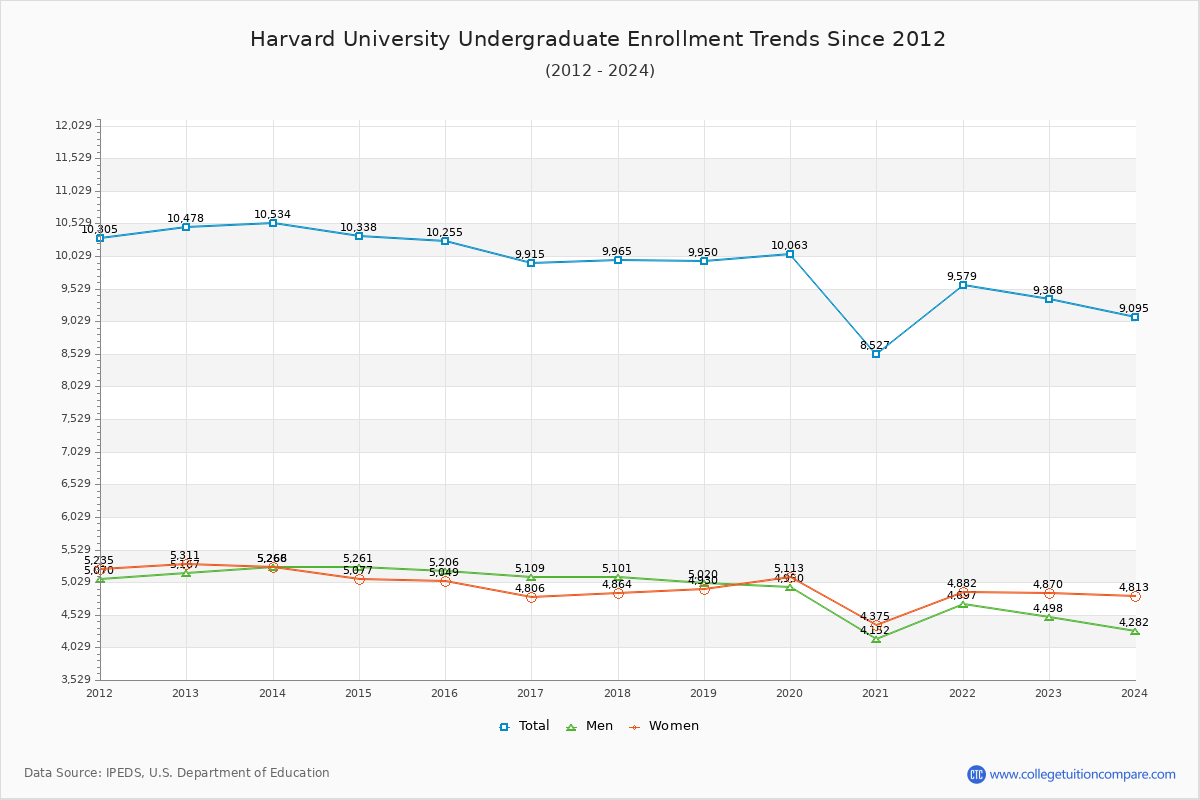
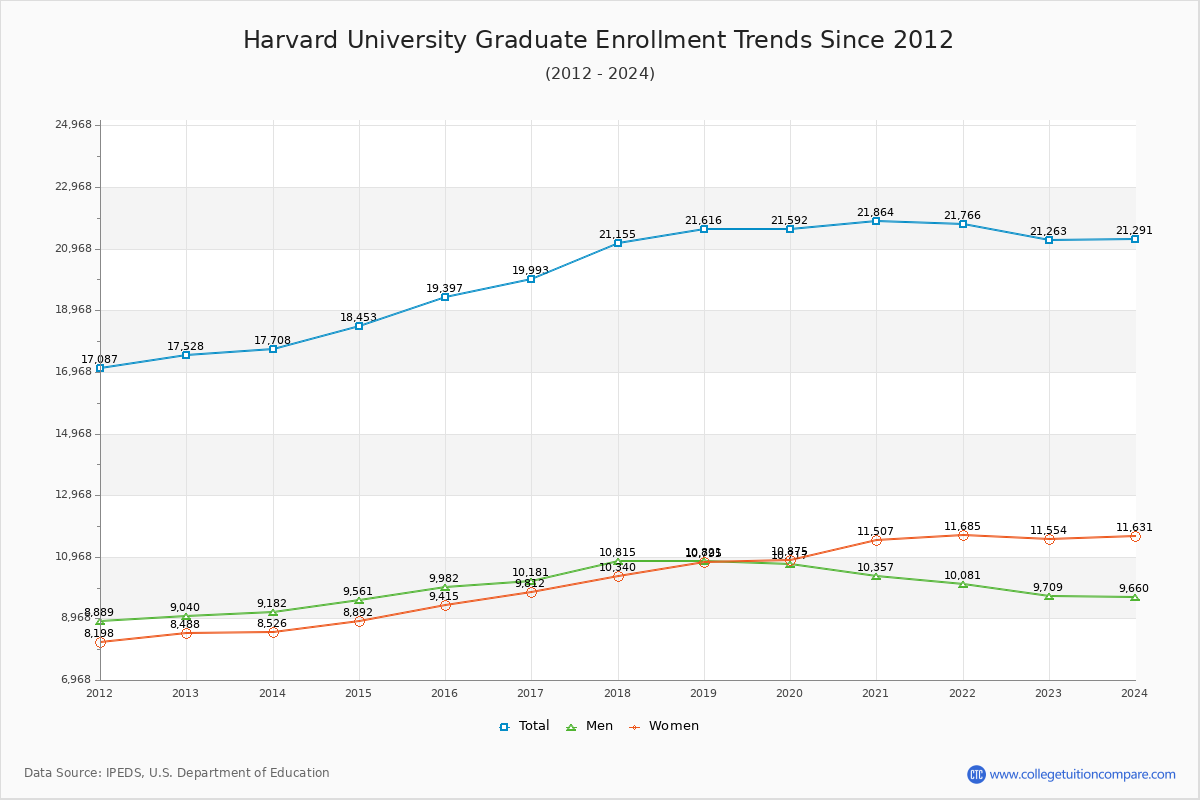
30.58% of total students is undergraduate students and 69.42% students is graduate students. The number of undergraduate students has decreased by 1,110 and the graduate enrollment has increased by 3,735 over past 10 years.
The female to male ratio is 1.16 to 1 and it means that there are slightly more female students enrolled in Harvard than male students.
The following table and chart illustrate the changes in student population by gender at Harvard University since 2012.
| Year | Total | Undergraduate | Graduate | ||||
|---|---|---|---|---|---|---|---|
| Total | Men | Women | Total | Men | Women | ||
| 2012-13 | 28,006 | 10,478 | 5,167 | 5,311 | 17,528 | 9,040 | 8,488 |
| 2013-14 | 28,242 236 | 10,534 56 | 5,268 101 | 5,266 -45 | 17,708 180 | 9,182 142 | 8,526 38 |
| 2014-15 | 28,791 549 | 10,338 -196 | 5,261 -7 | 5,077 -189 | 18,453 745 | 9,561 379 | 8,892 366 |
| 2015-16 | 29,652 861 | 10,255 -83 | 5,206 -55 | 5,049 -28 | 19,397 944 | 9,982 421 | 9,415 523 |
| 2016-17 | 29,908 256 | 9,915 -340 | 5,109 -97 | 4,806 -243 | 19,993 596 | 10,181 199 | 9,812 397 |
| 2017-18 | 31,120 1,212 | 9,965 50 | 5,101 -8 | 4,864 58 | 21,155 1,162 | 10,815 634 | 10,340 528 |
| 2018-19 | 31,566 446 | 9,950 -15 | 5,020 -81 | 4,930 66 | 21,616 461 | 10,821 6 | 10,795 455 |
| 2019-20 | 31,655 89 | 10,063 113 | 4,950 -70 | 5,113 183 | 21,592 -24 | 10,717 -104 | 10,875 80 |
| 2020-21 | 30,391 -1,264 | 8,527 -1,536 | 4,152 -798 | 4,375 -738 | 21,864 272 | 10,357 -360 | 11,507 632 |
| 2021-22 | 31,345 954 | 9,579 1,052 | 4,697 545 | 4,882 507 | 21,766 -98 | 10,081 -276 | 11,685 178 |
| 2022-23 | 30,631 -714 | 9,368 -211 | 4,498 -199 | 4,870 -12 | 21,263 -503 | 9,709 -372 | 11,554 -131 |
| Average | 30,119 | 9,907 | 4,948 | 4,958 | 20,212 | 10,041 | 10,172 |