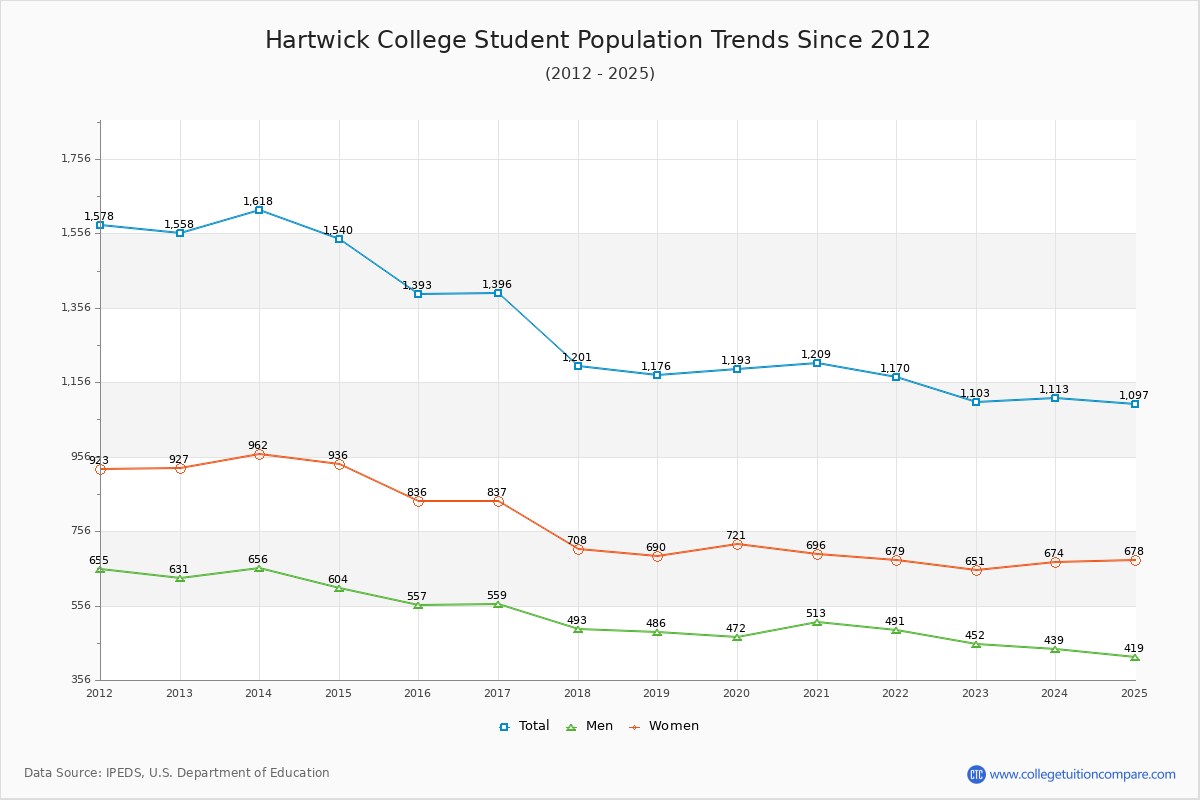
Student Population Changes
The average student population over the last 12 years is 1,323 where 1,103 students are attending the school for the academic year 2022-2023.
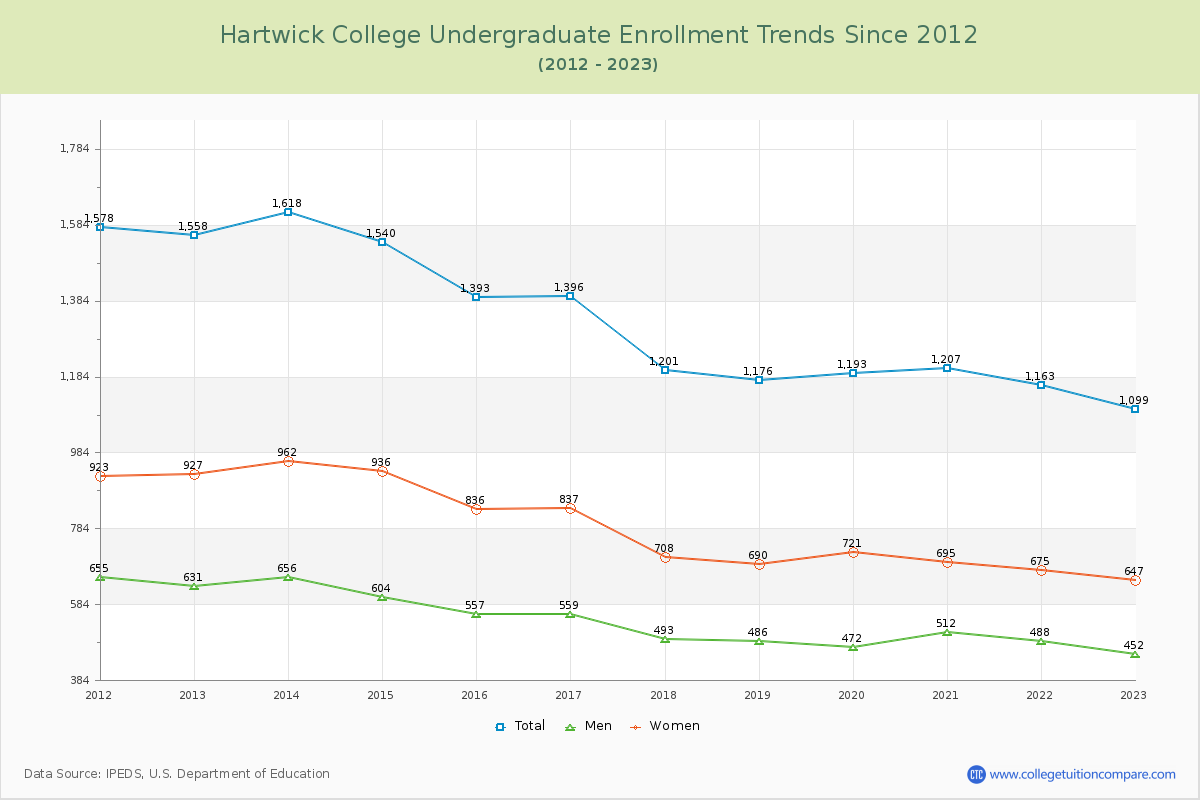
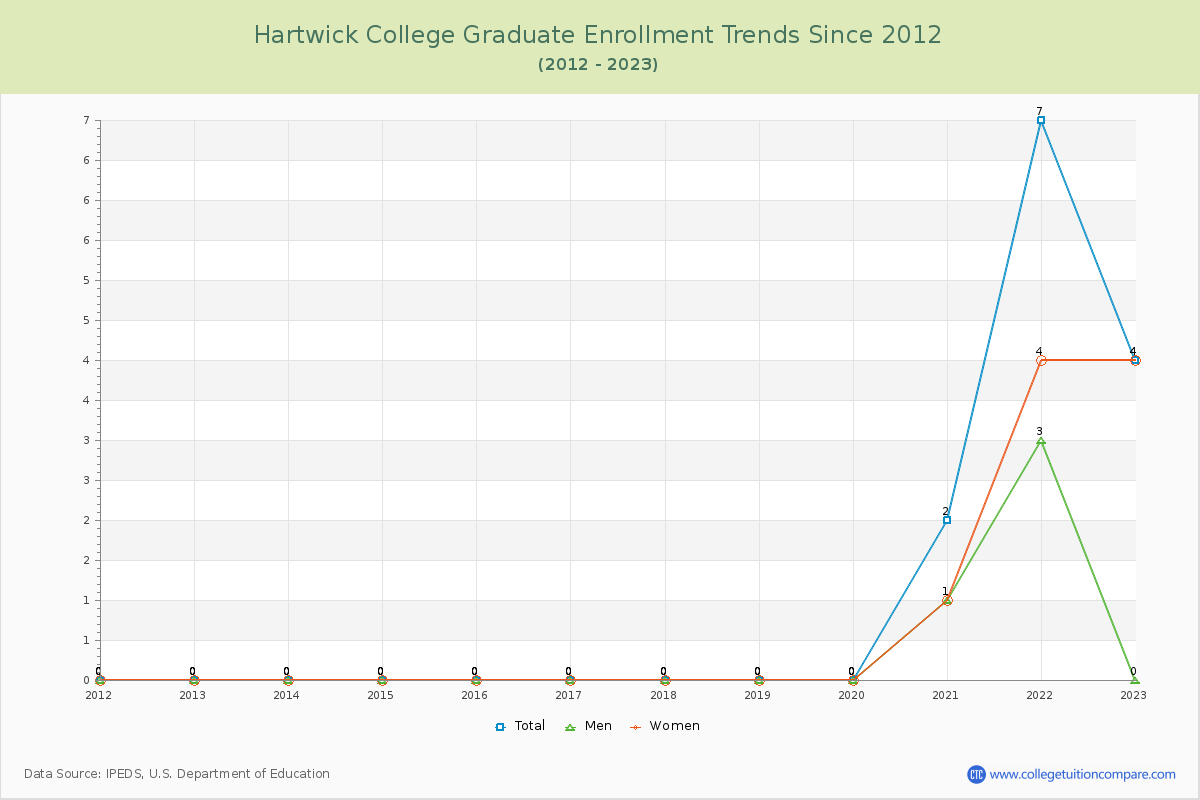
99.64% of total students is undergraduate students and 0.36% students is graduate students. The number of undergraduate students has decreased by 459 and the graduate enrollment has increased by 4 over past 10 years.
The female to male ratio is 1.44 to 1 and it means that there are more female students enrolled in Hartwick than male students.
The following table and chart illustrate the changes in student population by gender at Hartwick College since 2012.
| Year | Total | Undergraduate | Graduate | ||||
|---|---|---|---|---|---|---|---|
| Total | Men | Women | Total | Men | Women | ||
| 2012-13 | 1,558 | 1,558 | 631 | 927 | 0 | 0 | 0 |
| 2013-14 | 1,618 60 | 1,618 60 | 656 25 | 962 35 | 0 0 | 0 0 | 0 0 |
| 2014-15 | 1,540 -78 | 1,540 -78 | 604 -52 | 936 -26 | 0 0 | 0 0 | 0 0 |
| 2015-16 | 1,393 -147 | 1,393 -147 | 557 -47 | 836 -100 | 0 0 | 0 0 | 0 0 |
| 2016-17 | 1,396 3 | 1,396 3 | 559 2 | 837 1 | 0 0 | 0 0 | 0 0 |
| 2017-18 | 1,201 -195 | 1,201 -195 | 493 -66 | 708 -129 | 0 0 | 0 0 | 0 0 |
| 2018-19 | 1,176 -25 | 1,176 -25 | 486 -7 | 690 -18 | 0 0 | 0 0 | 0 0 |
| 2019-20 | 1,193 17 | 1,193 17 | 472 -14 | 721 31 | 0 0 | 0 0 | 0 0 |
| 2020-21 | 1,209 16 | 1,207 14 | 512 40 | 695 -26 | 2 2 | 1 1 | 1 1 |
| 2021-22 | 1,170 -39 | 1,163 -44 | 488 -24 | 675 -20 | 7 5 | 3 2 | 4 3 |
| 2022-23 | 1,103 -67 | 1,099 -64 | 452 -36 | 647 -28 | 4 -3 | 0 -3 | 4 0 |
| Average | 1,323 | 1,322 | 537 | 785 | 1 | 0 | 1 |