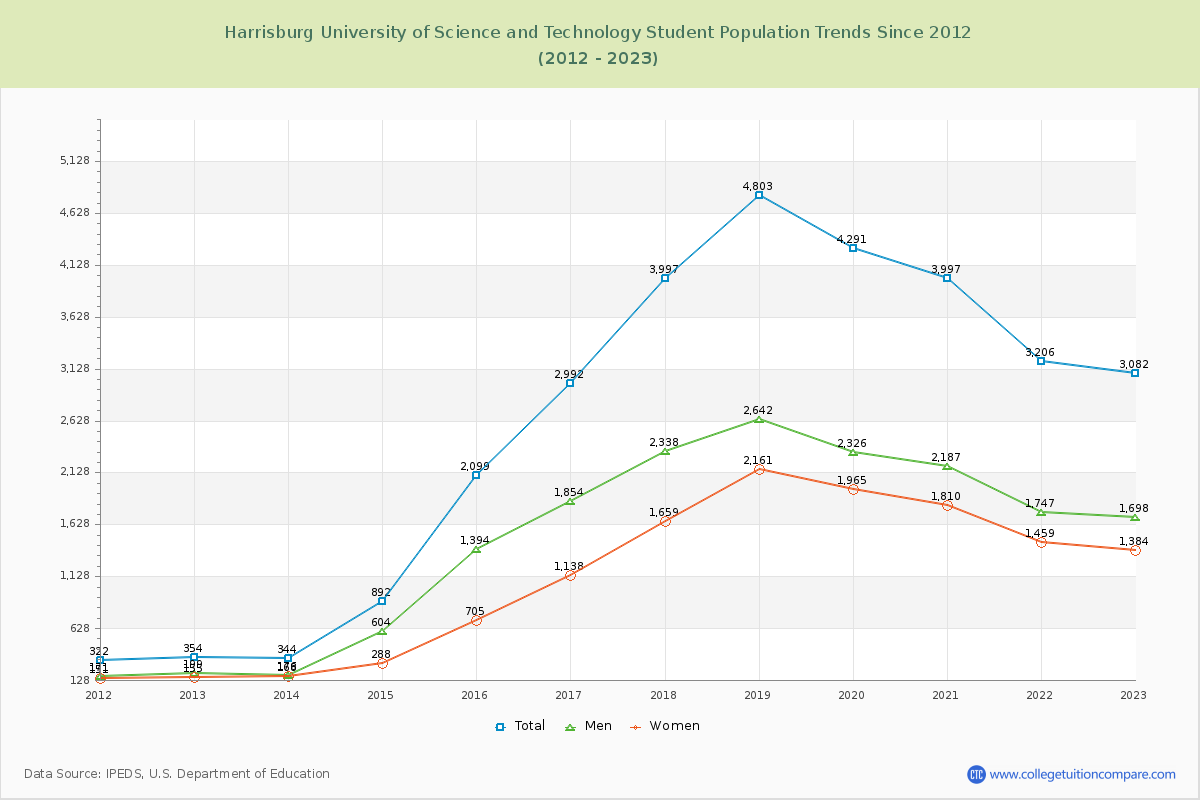
Student Population Changes
The average student population over the last 12 years is 2,732 where 3,082 students are attending the school for the academic year 2022-2023.
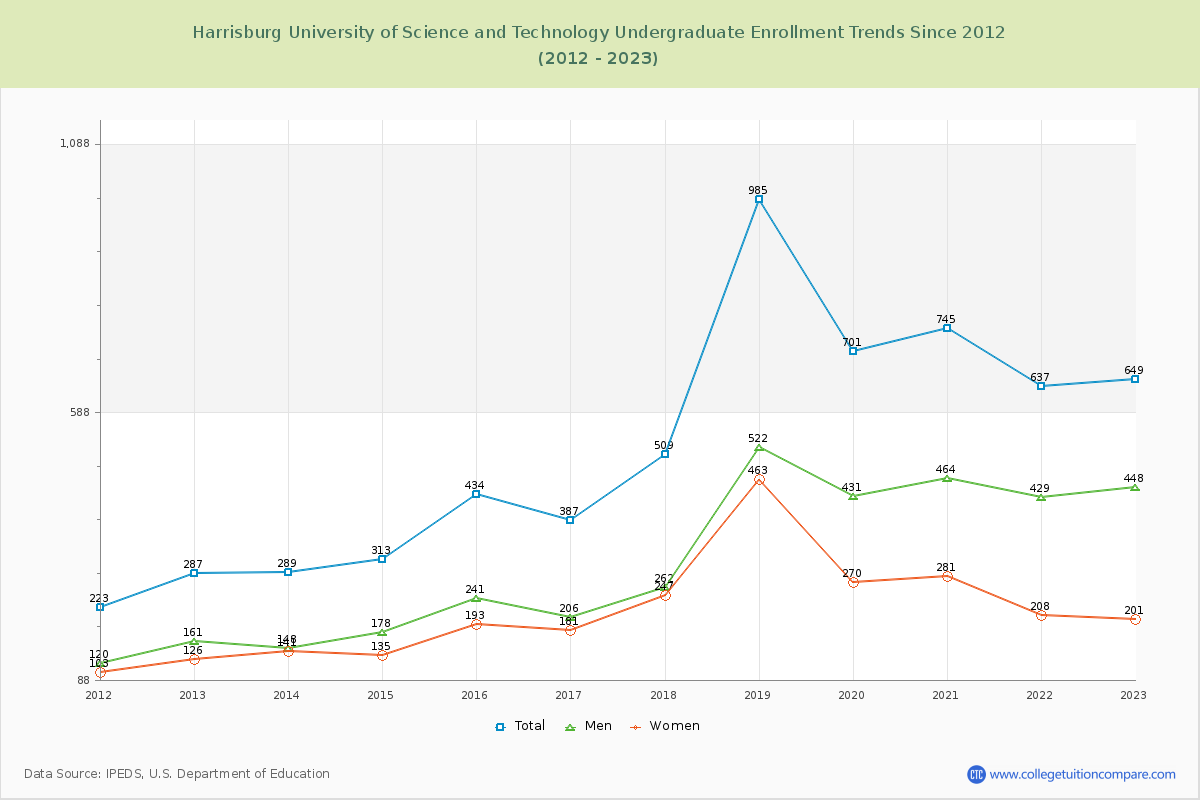
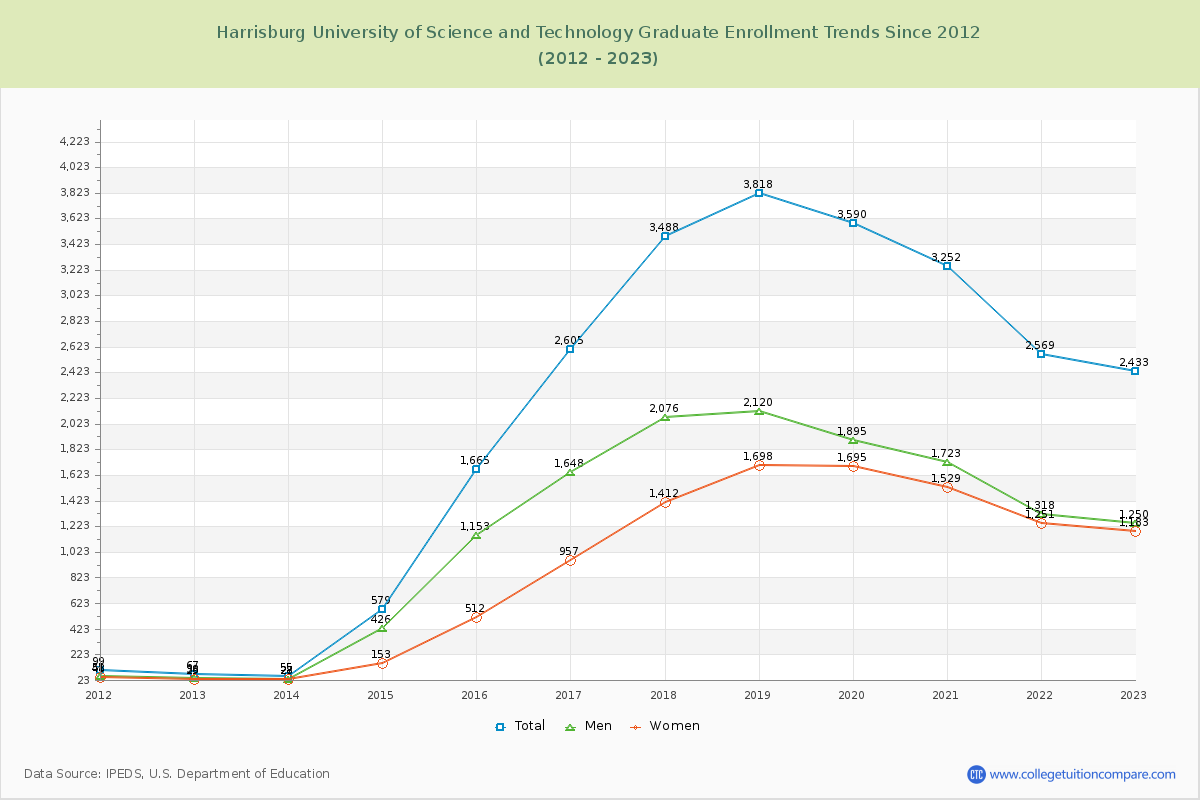
21.06% of total students is undergraduate students and 78.94% students is graduate students. The number of undergraduate students has increased by 362 and the graduate enrollment has increased by 2,366 over past 10 years.
The female to male ratio is 0.82 to 1 and it means that there are slightly more male students enrolled in Harrisburg University of Science and Technology than female students.
The following table and chart illustrate the changes in student population by gender at Harrisburg University of Science and Technology since 2012.
| Year | Total | Undergraduate | Graduate | ||||
|---|---|---|---|---|---|---|---|
| Total | Men | Women | Total | Men | Women | ||
| 2012-13 | 354 | 287 | 161 | 126 | 67 | 38 | 29 |
| 2013-14 | 344 -10 | 289 2 | 148 -13 | 141 15 | 55 -12 | 28 -10 | 27 -2 |
| 2014-15 | 892 548 | 313 24 | 178 30 | 135 -6 | 579 524 | 426 398 | 153 126 |
| 2015-16 | 2,099 1,207 | 434 121 | 241 63 | 193 58 | 1,665 1,086 | 1,153 727 | 512 359 |
| 2016-17 | 2,992 893 | 387 -47 | 206 -35 | 181 -12 | 2,605 940 | 1,648 495 | 957 445 |
| 2017-18 | 3,997 1,005 | 509 122 | 262 56 | 247 66 | 3,488 883 | 2,076 428 | 1,412 455 |
| 2018-19 | 4,803 806 | 985 476 | 522 260 | 463 216 | 3,818 330 | 2,120 44 | 1,698 286 |
| 2019-20 | 4,291 -512 | 701 -284 | 431 -91 | 270 -193 | 3,590 -228 | 1,895 -225 | 1,695 -3 |
| 2020-21 | 3,997 -294 | 745 44 | 464 33 | 281 11 | 3,252 -338 | 1,723 -172 | 1,529 -166 |
| 2021-22 | 3,206 -791 | 637 -108 | 429 -35 | 208 -73 | 2,569 -683 | 1,318 -405 | 1,251 -278 |
| 2022-23 | 3,082 -124 | 649 12 | 448 19 | 201 -7 | 2,433 -136 | 1,250 -68 | 1,183 -68 |
| Average | 2,732 | 540 | 317 | 222 | 2,193 | 1,243 | 950 |