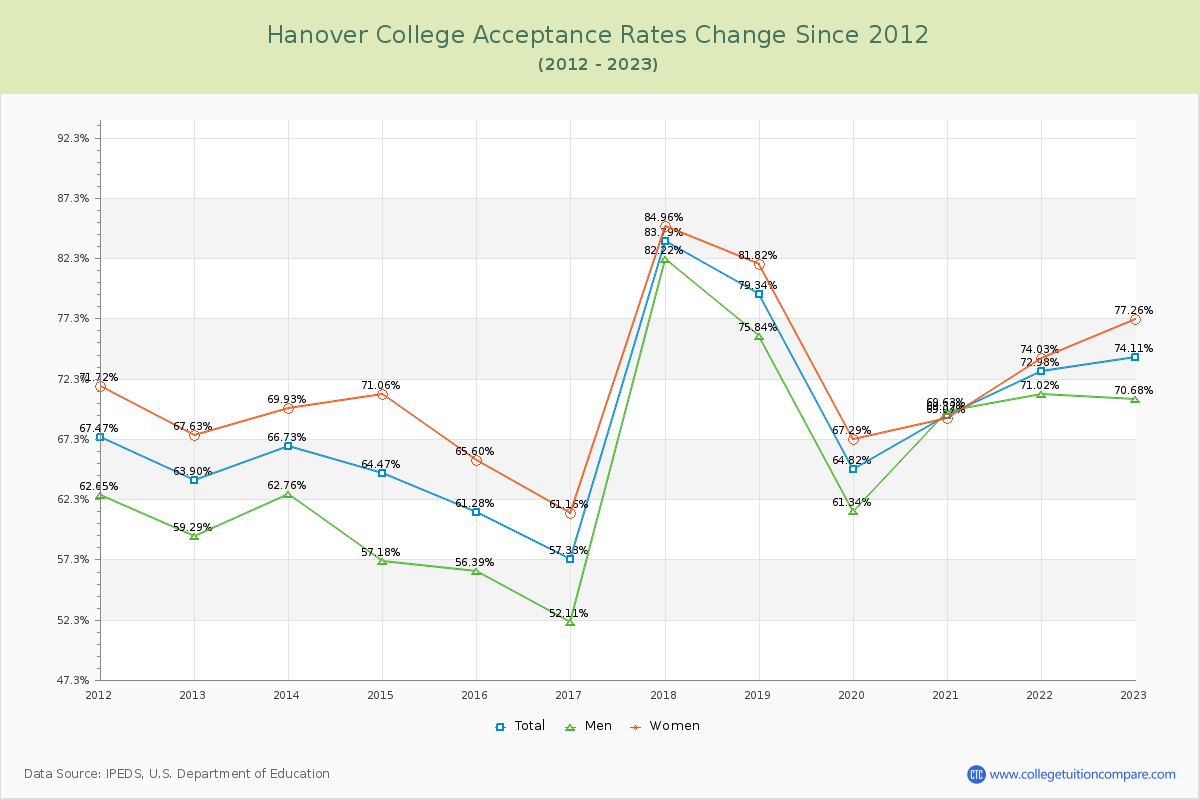
Acceptance Rate Changes
The average acceptance rate over the last 10 years is 68.92%, and this year's acceptance rate is 74.11% at Hanover College. By gender, men students' acceptance rate is 65.31% and women students' rate is 71.80%.
The next table and chart illustrate the acceptance rates changes at Hanover College over the past 11 years (2012-2023).
| Year | Total | Men | Women |
|---|---|---|---|
| 2012-13 | 63.90% | 59.29% | 67.63% |
| 2013-14 | 66.73% 2.83% |
62.76% 2.30% |
69.93% 2.30% |
| 2014-15 | 64.47% -2.26% |
57.18% 1.14% |
71.06% 1.14% |
| 2015-16 | 61.28% -3.19% |
56.39% -5.46% |
65.60% -5.46% |
| 2016-17 | 57.33% -3.95% |
52.11% -4.44% |
61.16% -4.44% |
| 2017-18 | 83.79% 26.45% |
82.22% 23.80% |
84.96% 23.80% |
| 2018-19 | 79.34% -4.44% |
75.84% -3.14% |
81.82% -3.14% |
| 2019-20 | 64.82% -14.52% |
61.34% -14.53% |
67.29% -14.53% |
| 2020-21 | 69.32% 4.50% |
69.63% 1.78% |
69.07% 1.78% |
| 2021-22 | 72.98% 3.66% |
71.02% 4.96% |
74.03% 4.96% |
| 2022-23 | 74.11% 1.13% |
70.68% 3.23% |
77.26% 3.23% |
| Average | 68.92% | 65.31% | 71.80% |