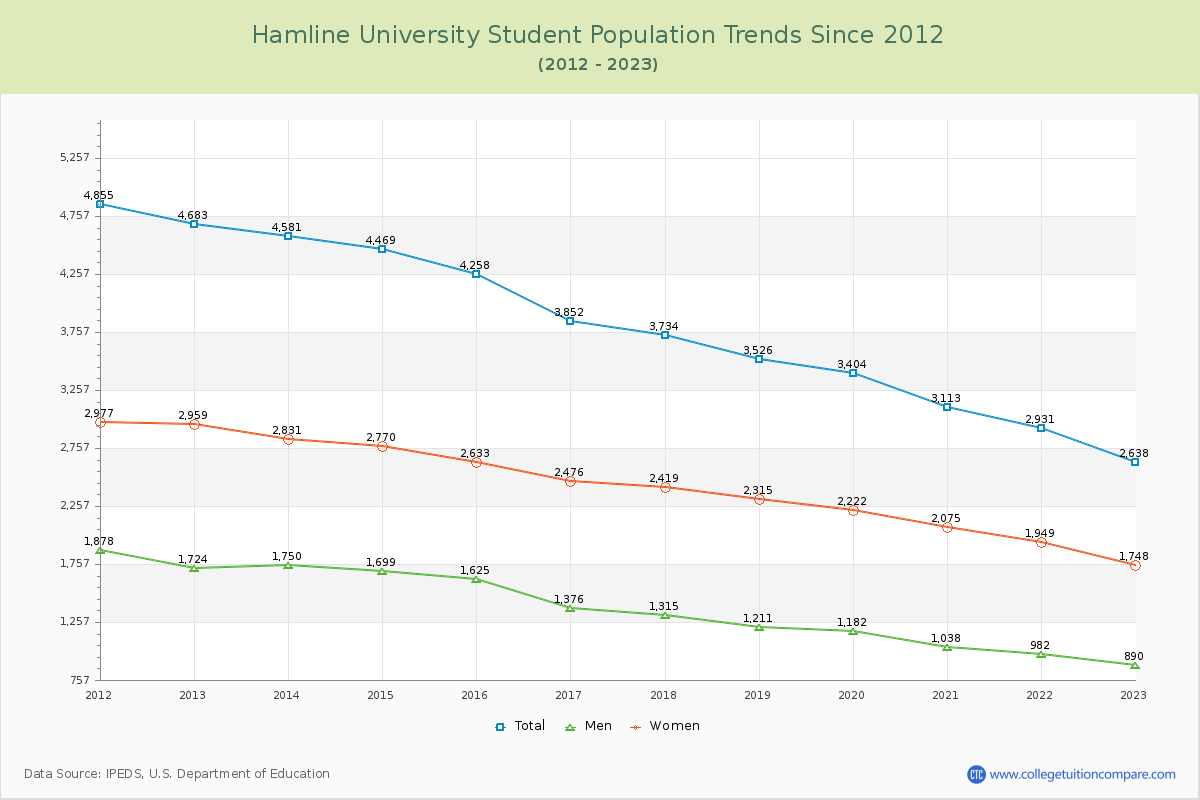
Student Population Changes
The average student population over the last 12 years is 3,744 where 2,638 students are attending the school for the academic year 2022-2023.
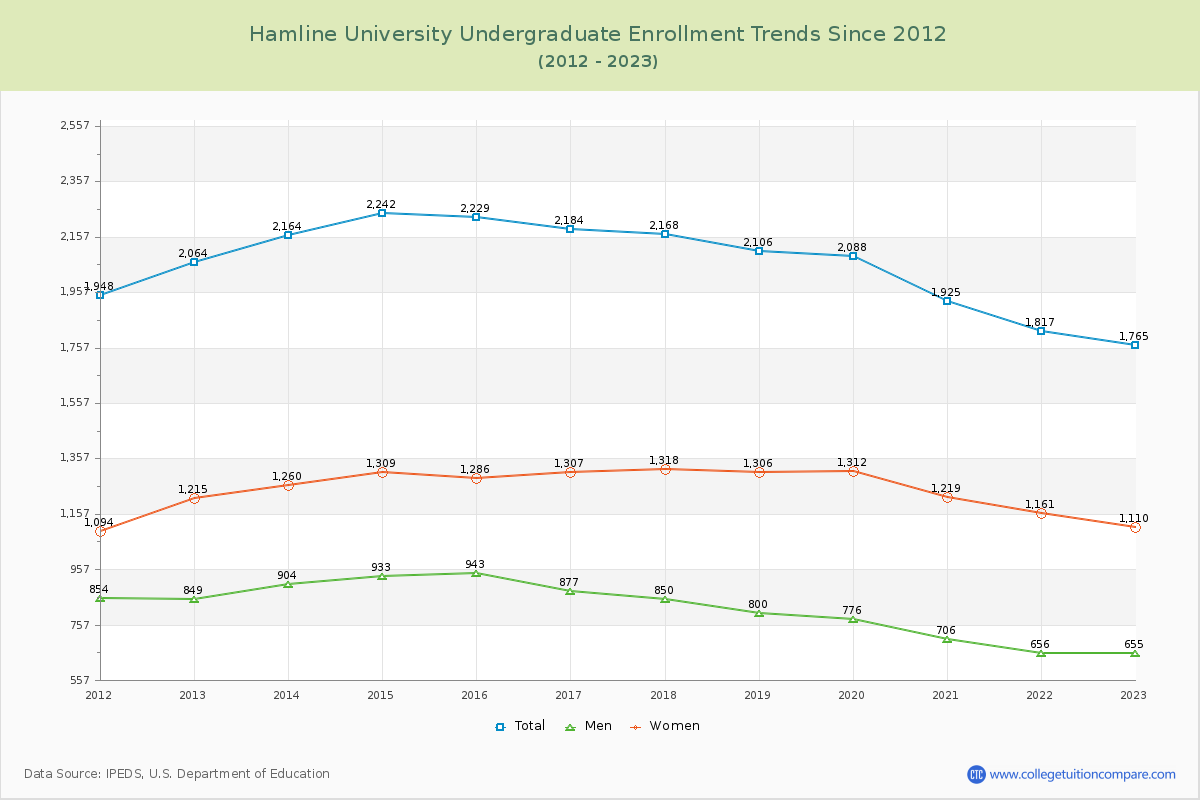
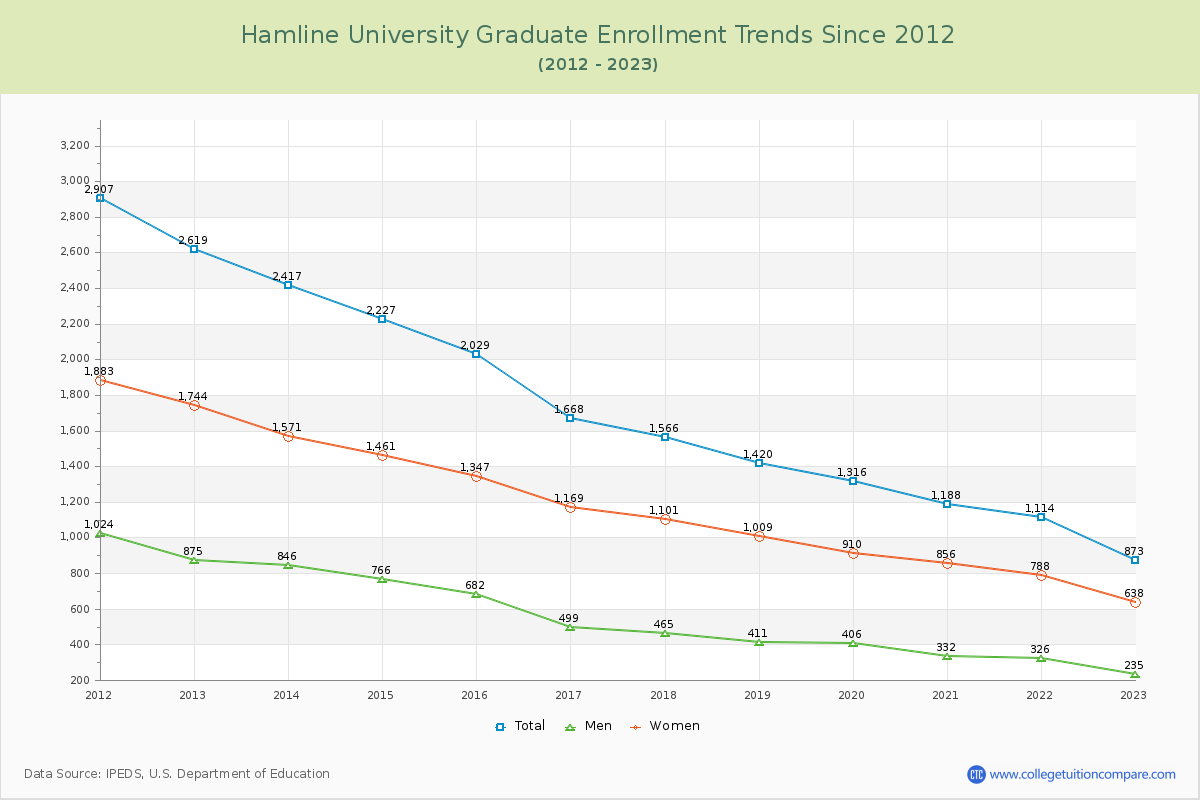
66.91% of total students is undergraduate students and 33.09% students is graduate students. The number of undergraduate students has decreased by 299 and the graduate enrollment has decreased by 1,746 over past 10 years.
The female to male ratio is 1.96 to 1 and it means that there are more female students enrolled in Hamline than male students.
The following table and chart illustrate the changes in student population by gender at Hamline University since 2012.
| Year | Total | Undergraduate | Graduate | ||||
|---|---|---|---|---|---|---|---|
| Total | Men | Women | Total | Men | Women | ||
| 2012-13 | 4,683 | 2,064 | 849 | 1,215 | 2,619 | 875 | 1,744 |
| 2013-14 | 4,581 -102 | 2,164 100 | 904 55 | 1,260 45 | 2,417 -202 | 846 -29 | 1,571 -173 |
| 2014-15 | 4,469 -112 | 2,242 78 | 933 29 | 1,309 49 | 2,227 -190 | 766 -80 | 1,461 -110 |
| 2015-16 | 4,258 -211 | 2,229 -13 | 943 10 | 1,286 -23 | 2,029 -198 | 682 -84 | 1,347 -114 |
| 2016-17 | 3,852 -406 | 2,184 -45 | 877 -66 | 1,307 21 | 1,668 -361 | 499 -183 | 1,169 -178 |
| 2017-18 | 3,734 -118 | 2,168 -16 | 850 -27 | 1,318 11 | 1,566 -102 | 465 -34 | 1,101 -68 |
| 2018-19 | 3,526 -208 | 2,106 -62 | 800 -50 | 1,306 -12 | 1,420 -146 | 411 -54 | 1,009 -92 |
| 2019-20 | 3,404 -122 | 2,088 -18 | 776 -24 | 1,312 6 | 1,316 -104 | 406 -5 | 910 -99 |
| 2020-21 | 3,113 -291 | 1,925 -163 | 706 -70 | 1,219 -93 | 1,188 -128 | 332 -74 | 856 -54 |
| 2021-22 | 2,931 -182 | 1,817 -108 | 656 -50 | 1,161 -58 | 1,114 -74 | 326 -6 | 788 -68 |
| 2022-23 | 2,638 -293 | 1,765 -52 | 655 -1 | 1,110 -51 | 873 -241 | 235 -91 | 638 -150 |
| Average | 3,744 | 2,068 | 814 | 1,255 | 1,676 | 531 | 1,145 |