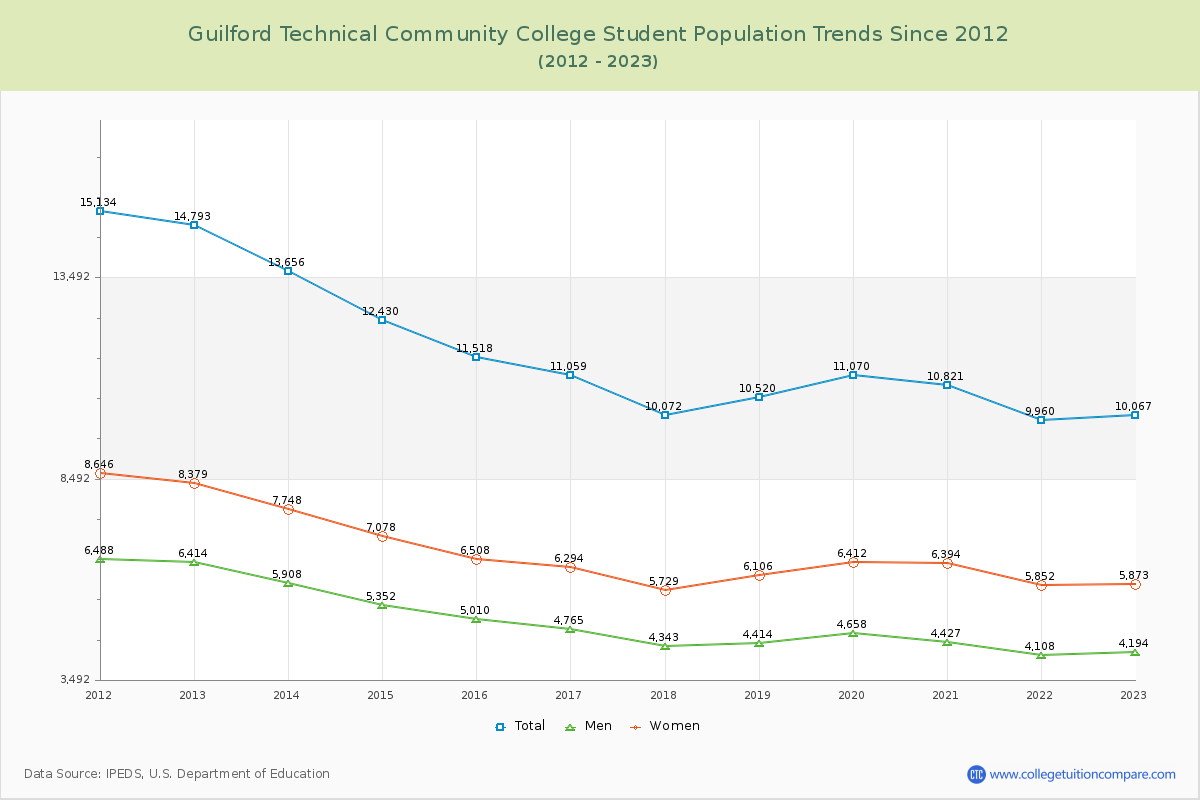
Student Population Changes
The average student population over the last 12 years is 11,451 where 10,067 students are attending the school for the academic year 2022-2023.
The female to male ratio is 1.40 to 1 and it means that there are more female students enrolled in Guilford Technical CC than male students.
The following table and chart illustrate the changes in student population by gender at Guilford Technical Community College since 2012.
| Year | Total | Men | Women |
|---|---|---|---|
| 2012-13 | 14,793 | 6,414 | 8,379 |
| 2013-14 | 13,656 -1,137 | 5,908 -506 | 7,748 -631 |
| 2014-15 | 12,430 -1,226 | 5,352 -556 | 7,078 -670 |
| 2015-16 | 11,518 -912 | 5,010 -342 | 6,508 -570 |
| 2016-17 | 11,059 -459 | 4,765 -245 | 6,294 -214 |
| 2017-18 | 10,072 -987 | 4,343 -422 | 5,729 -565 |
| 2018-19 | 10,520 448 | 4,414 71 | 6,106 377 |
| 2019-20 | 11,070 550 | 4,658 244 | 6,412 306 |
| 2020-21 | 10,821 -249 | 4,427 -231 | 6,394 -18 |
| 2021-22 | 9,960 -861 | 4,108 -319 | 5,852 -542 |
| 2022-23 | 10,067 107 | 4,194 86 | 5,873 21 |
| Average | 11,451 | 4,872 | 6,579 |