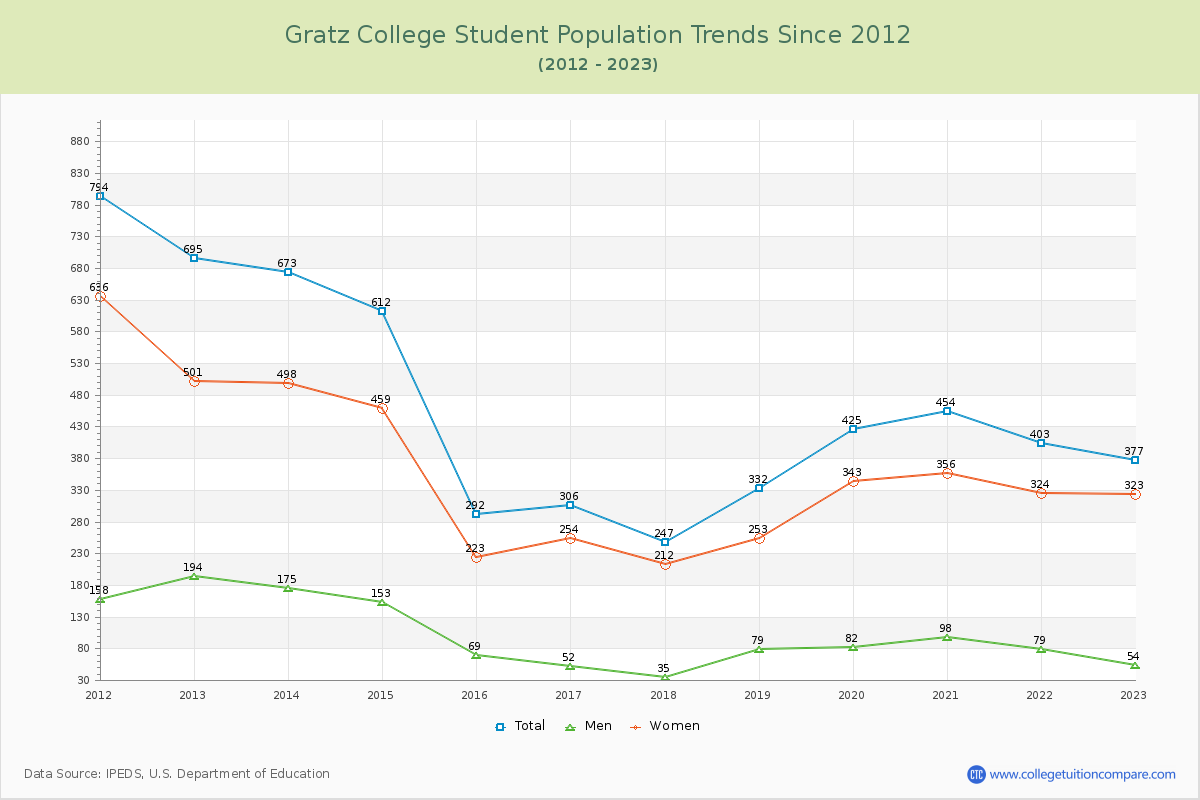
Student Population Changes
The average student population over the last 12 years is 438 where 377 students are attending the school for the academic year 2022-2023.
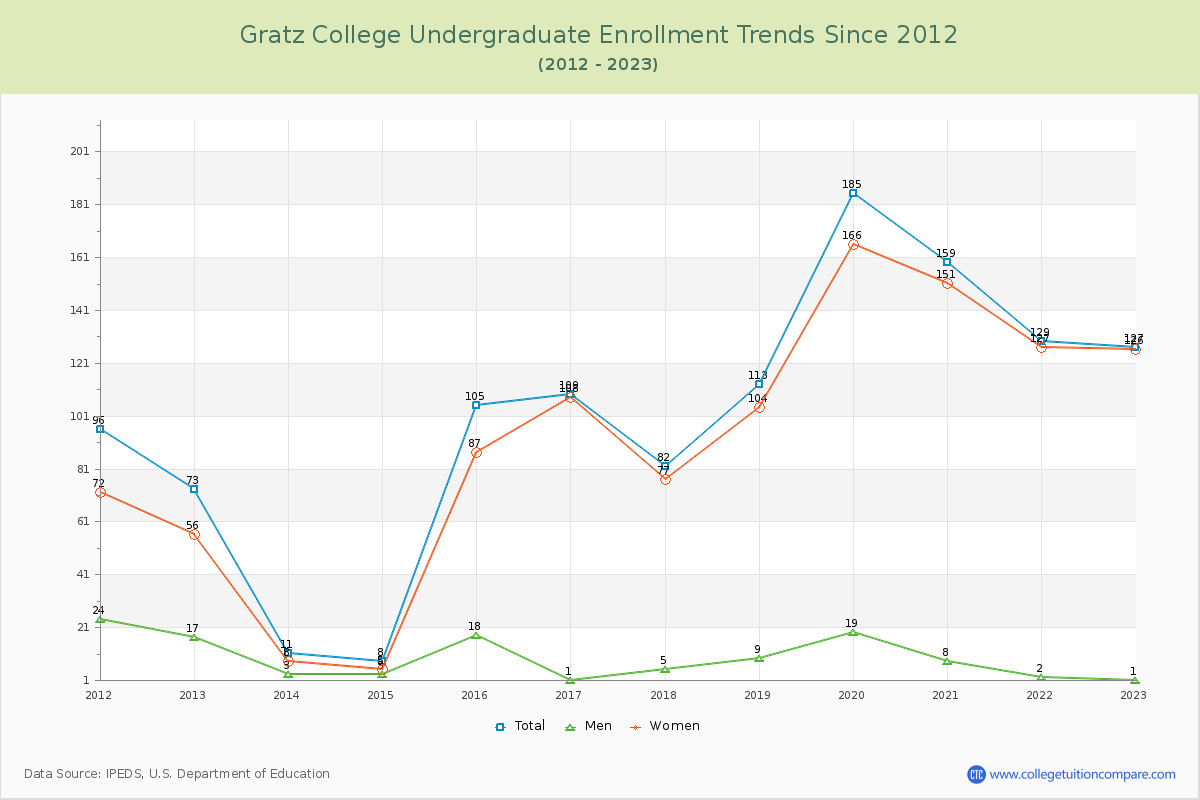
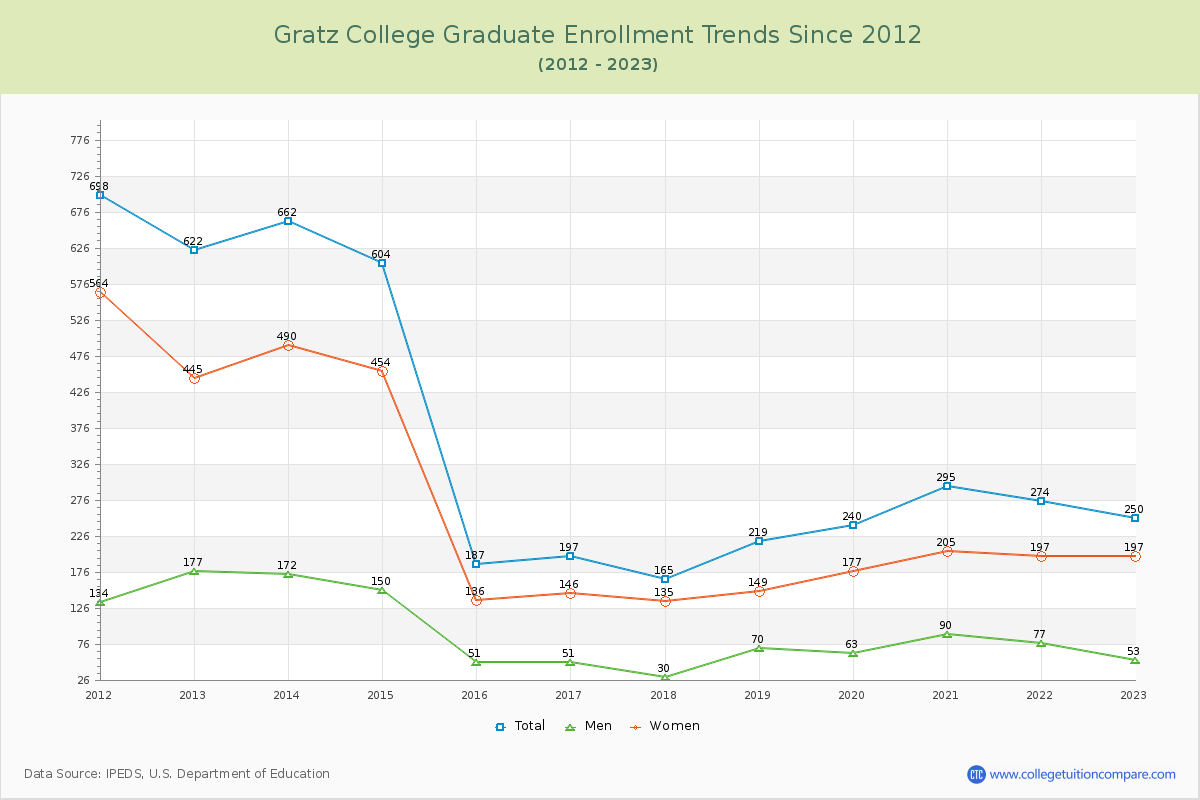
33.69% of total students is undergraduate students and 66.31% students is graduate students. The number of undergraduate students has increased by 54 and the graduate enrollment has decreased by 372 over past 10 years.
The female to male ratio is 5.98 to 1 and it means that there are far more female students enrolled in Gratz than male students.
The following table and chart illustrate the changes in student population by gender at Gratz College since 2012.
| Year | Total | Undergraduate | Graduate | ||||
|---|---|---|---|---|---|---|---|
| Total | Men | Women | Total | Men | Women | ||
| 2012-13 | 695 | 73 | 17 | 56 | 622 | 177 | 445 |
| 2013-14 | 673 -22 | 11 -62 | 3 -14 | 8 -48 | 662 40 | 172 -5 | 490 45 |
| 2014-15 | 612 -61 | 8 -3 | 3 0 | 5 -3 | 604 -58 | 150 -22 | 454 -36 |
| 2015-16 | 292 -320 | 105 97 | 18 15 | 87 82 | 187 -417 | 51 -99 | 136 -318 |
| 2016-17 | 306 14 | 109 4 | 1 -17 | 108 21 | 197 10 | 51 0 | 146 10 |
| 2017-18 | 247 -59 | 82 -27 | 5 4 | 77 -31 | 165 -32 | 30 -21 | 135 -11 |
| 2018-19 | 332 85 | 113 31 | 9 4 | 104 27 | 219 54 | 70 40 | 149 14 |
| 2019-20 | 425 93 | 185 72 | 19 10 | 166 62 | 240 21 | 63 -7 | 177 28 |
| 2020-21 | 454 29 | 159 -26 | 8 -11 | 151 -15 | 295 55 | 90 27 | 205 28 |
| 2021-22 | 403 -51 | 129 -30 | 2 -6 | 127 -24 | 274 -21 | 77 -13 | 197 -8 |
| 2022-23 | 377 -26 | 127 -2 | 1 -1 | 126 -1 | 250 -24 | 53 -24 | 197 0 |
| Average | 438 | 100 | 8 | 92 | 338 | 89 | 248 |