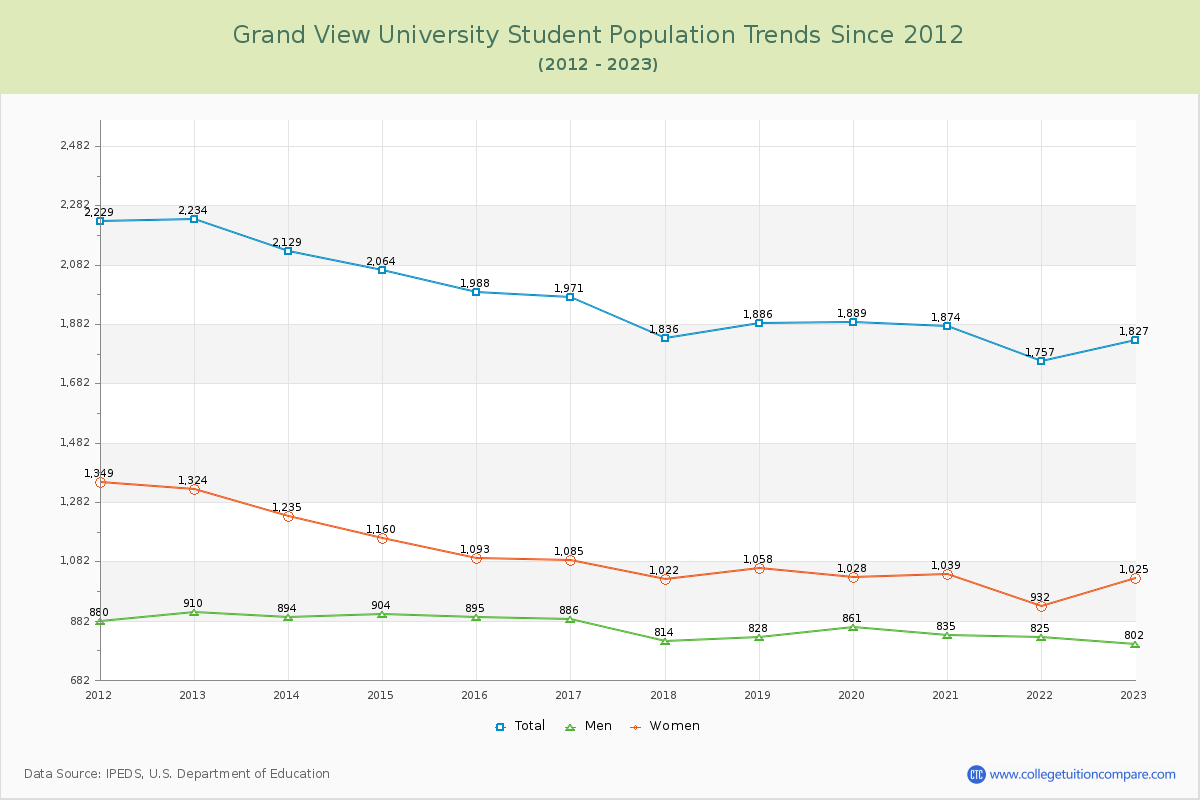
Student Population Changes
The average student population over the last 12 years is 1,950 where 1,827 students are attending the school for the academic year 2022-2023.
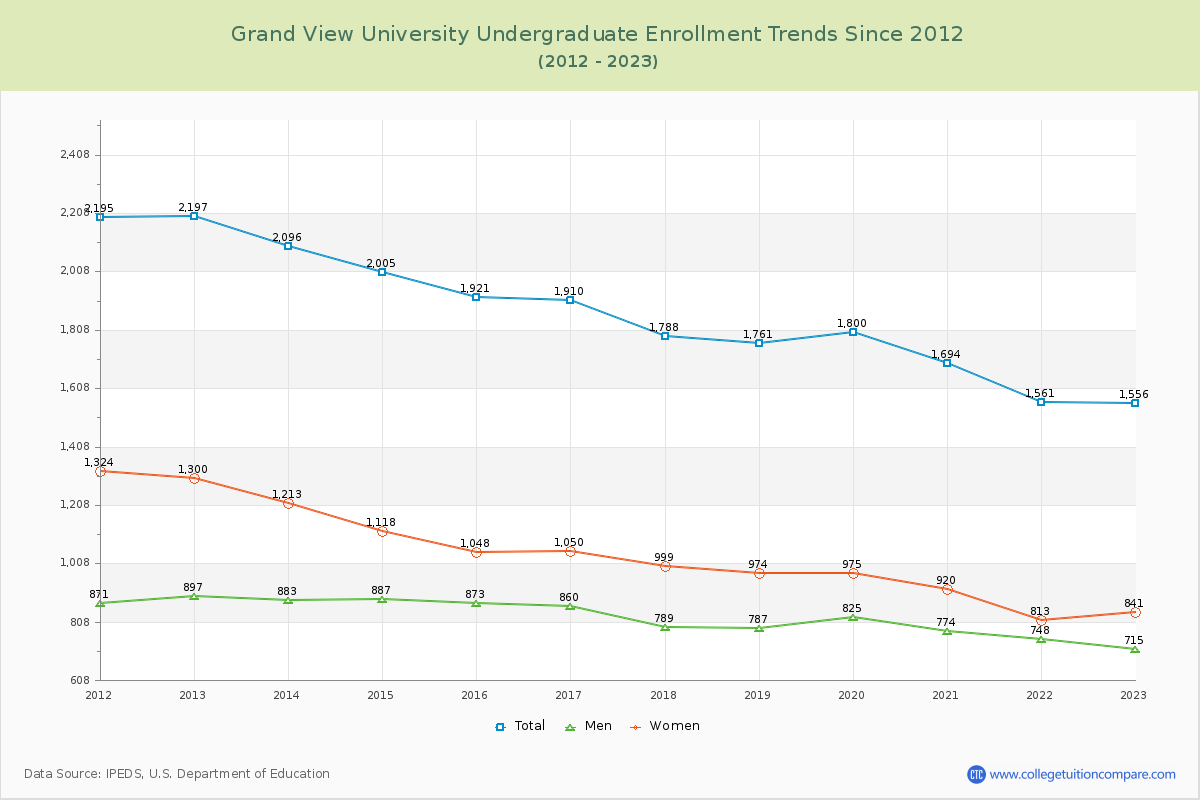
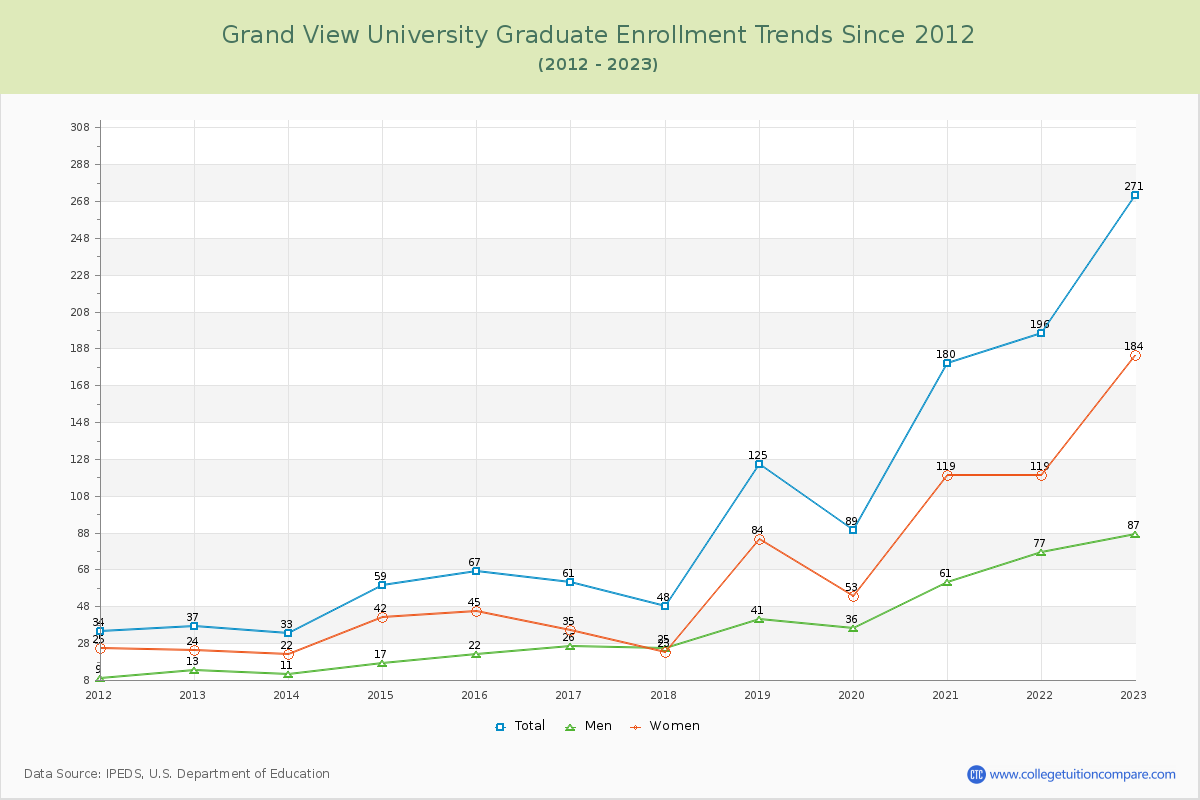
85.17% of total students is undergraduate students and 14.83% students is graduate students. The number of undergraduate students has decreased by 641 and the graduate enrollment has increased by 234 over past 10 years.
The female to male ratio is 1.28 to 1 and it means that there are slightly more female students enrolled in Grand View than male students.
The following table and chart illustrate the changes in student population by gender at Grand View University since 2012.
| Year | Total | Undergraduate | Graduate | ||||
|---|---|---|---|---|---|---|---|
| Total | Men | Women | Total | Men | Women | ||
| 2012-13 | 2,234 | 2,197 | 897 | 1,300 | 37 | 13 | 24 |
| 2013-14 | 2,129 -105 | 2,096 -101 | 883 -14 | 1,213 -87 | 33 -4 | 11 -2 | 22 -2 |
| 2014-15 | 2,064 -65 | 2,005 -91 | 887 4 | 1,118 -95 | 59 26 | 17 6 | 42 20 |
| 2015-16 | 1,988 -76 | 1,921 -84 | 873 -14 | 1,048 -70 | 67 8 | 22 5 | 45 3 |
| 2016-17 | 1,971 -17 | 1,910 -11 | 860 -13 | 1,050 2 | 61 -6 | 26 4 | 35 -10 |
| 2017-18 | 1,836 -135 | 1,788 -122 | 789 -71 | 999 -51 | 48 -13 | 25 -1 | 23 -12 |
| 2018-19 | 1,886 50 | 1,761 -27 | 787 -2 | 974 -25 | 125 77 | 41 16 | 84 61 |
| 2019-20 | 1,889 3 | 1,800 39 | 825 38 | 975 1 | 89 -36 | 36 -5 | 53 -31 |
| 2020-21 | 1,874 -15 | 1,694 -106 | 774 -51 | 920 -55 | 180 91 | 61 25 | 119 66 |
| 2021-22 | 1,757 -117 | 1,561 -133 | 748 -26 | 813 -107 | 196 16 | 77 16 | 119 0 |
| 2022-23 | 1,827 70 | 1,556 -5 | 715 -33 | 841 28 | 271 75 | 87 10 | 184 65 |
| Average | 1,950 | 1,844 | 822 | 1,023 | 106 | 38 | 68 |