Student Population Changes
The average student population over the last 11 years is 220 where 342 students are attending the school for the academic year 2022-2023.
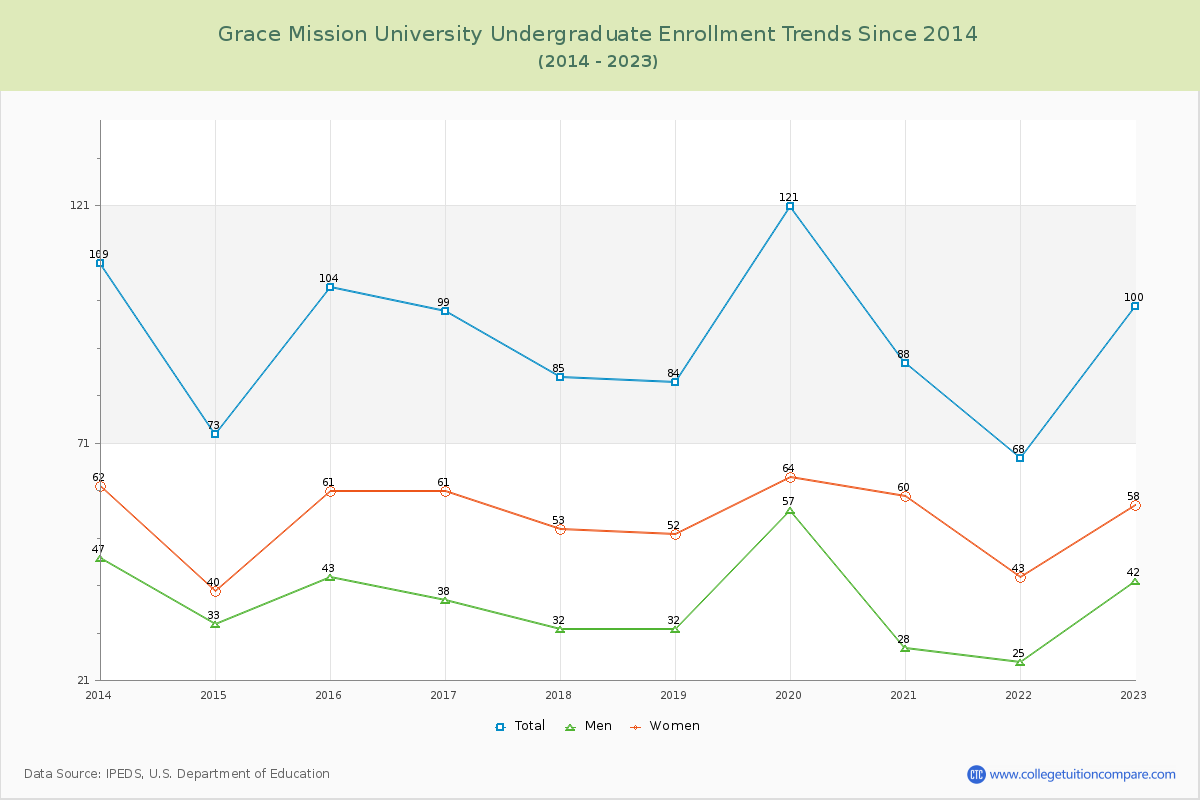
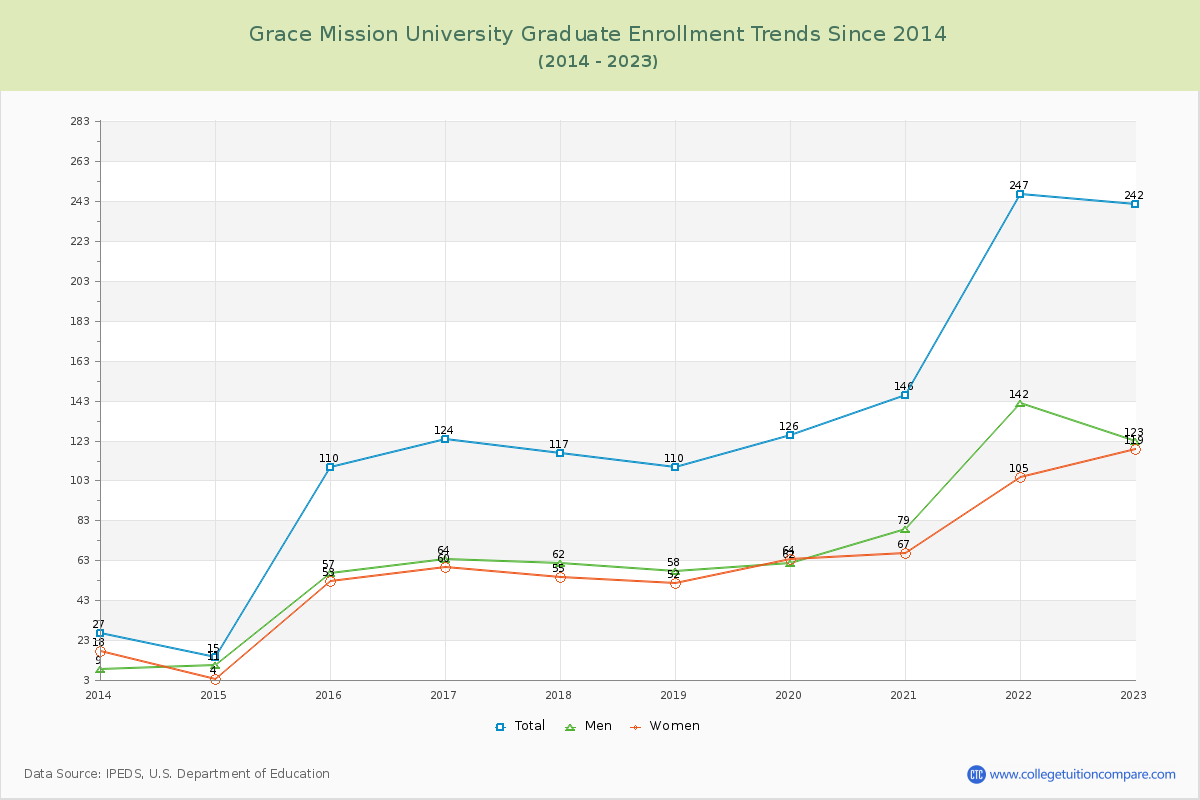
29.24% of total students is undergraduate students and 70.76% students is graduate students. The number of undergraduate students has decreased by 9 and the graduate enrollment has increased by 215 over past 10 years.
The female to male ratio is 1.07 to 1 and it means that there are similar numbers of female and male students enrolled in Grace Mission.
The following table and chart illustrate the changes in student population by gender at Grace Mission University since 2013.
| Year | Total | Undergraduate | Graduate | ||||
|---|---|---|---|---|---|---|---|
| Total | Men | Women | Total | Men | Women | ||
| 2013-14 | 136 | 109 | 47 | 62 | 27 | 9 | 18 |
| 2014-15 | 88 -48 | 73 -36 | 33 -14 | 40 -22 | 15 -12 | 11 2 | 4 -14 |
| 2015-16 | 214 126 | 104 31 | 43 10 | 61 21 | 110 95 | 57 46 | 53 49 |
| 2016-17 | 223 9 | 99 -5 | 38 -5 | 61 0 | 124 14 | 64 7 | 60 7 |
| 2017-18 | 202 -21 | 85 -14 | 32 -6 | 53 -8 | 117 -7 | 62 -2 | 55 -5 |
| 2018-19 | 194 -8 | 84 -1 | 32 0 | 52 -1 | 110 -7 | 58 -4 | 52 -3 |
| 2019-20 | 247 53 | 121 37 | 57 25 | 64 12 | 126 16 | 62 4 | 64 12 |
| 2020-21 | 234 -13 | 88 -33 | 28 -29 | 60 -4 | 146 20 | 79 17 | 67 3 |
| 2021-22 | 315 81 | 68 -20 | 25 -3 | 43 -17 | 247 101 | 142 63 | 105 38 |
| 2022-23 | 342 27 | 100 32 | 42 17 | 58 15 | 242 -5 | 123 -19 | 119 14 |
| Average | 220 | 93 | 38 | 55 | 126 | 67 | 60 |