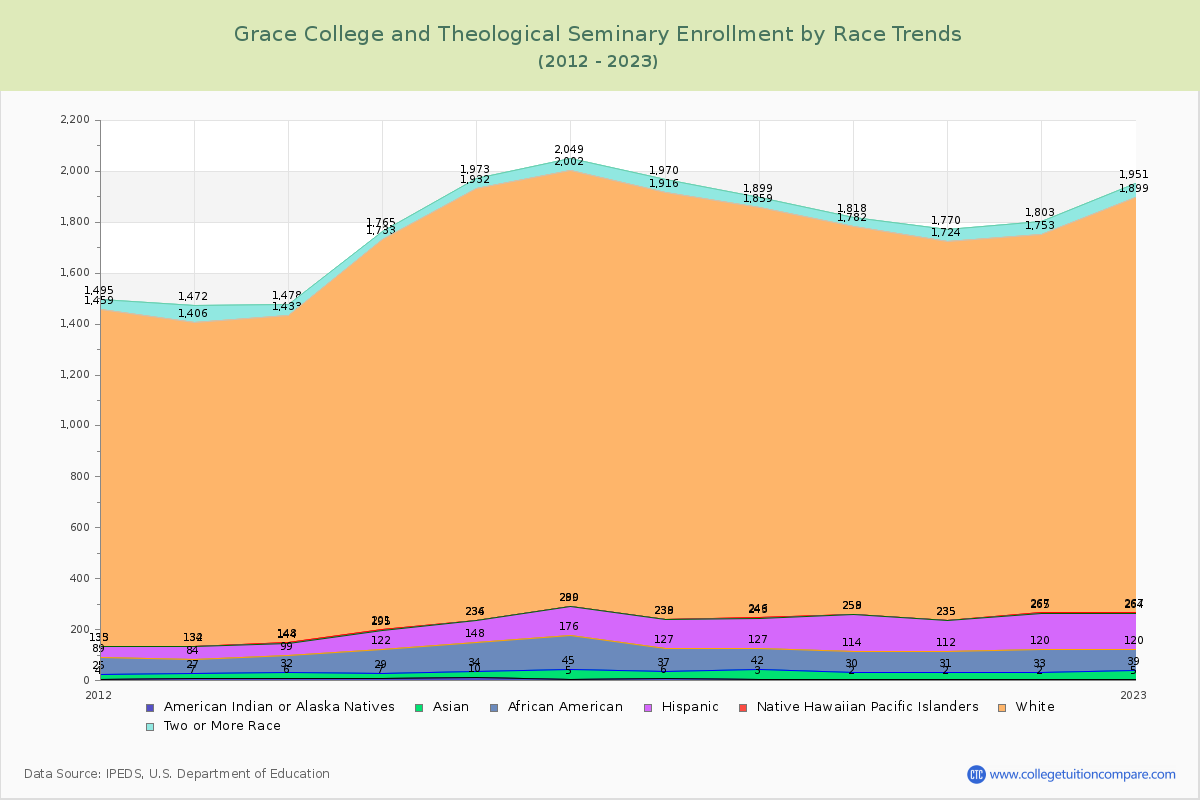
Student Population Changes
The average student population over the last 12 years is 2,049 where 2,065 students are attending the school for the academic year 2022-2023.
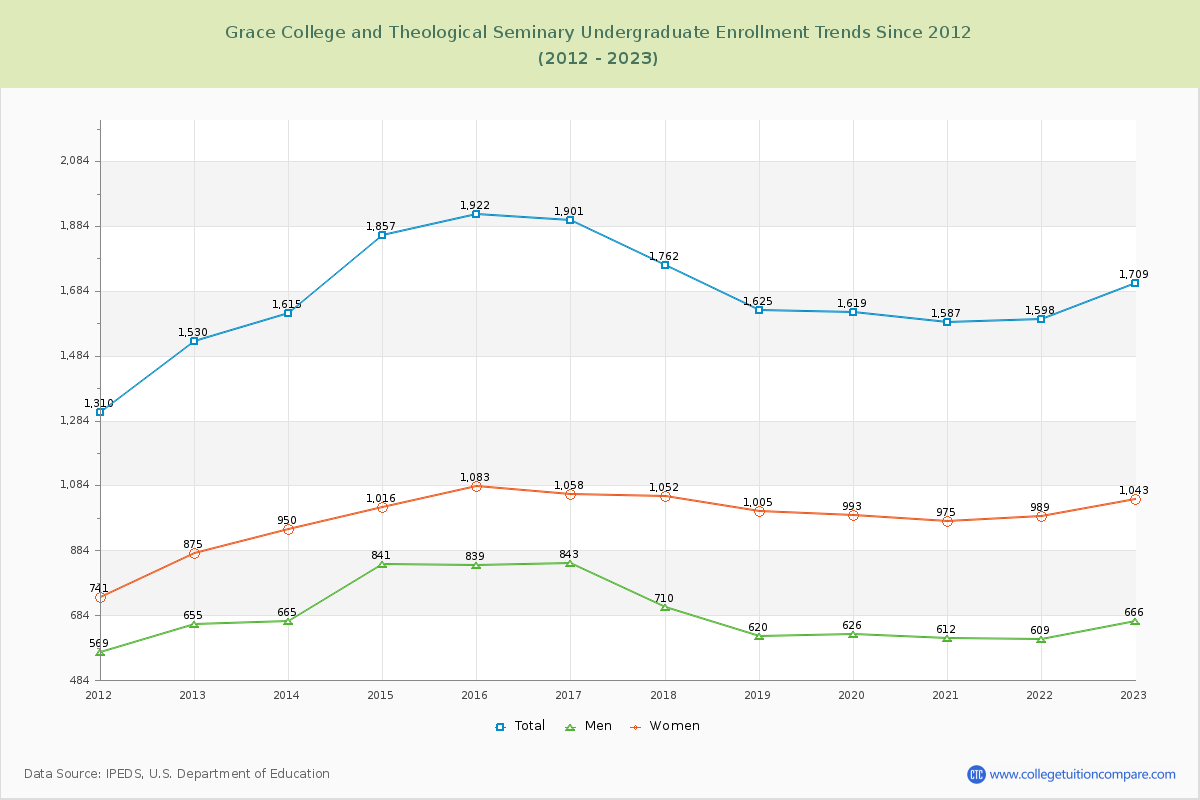
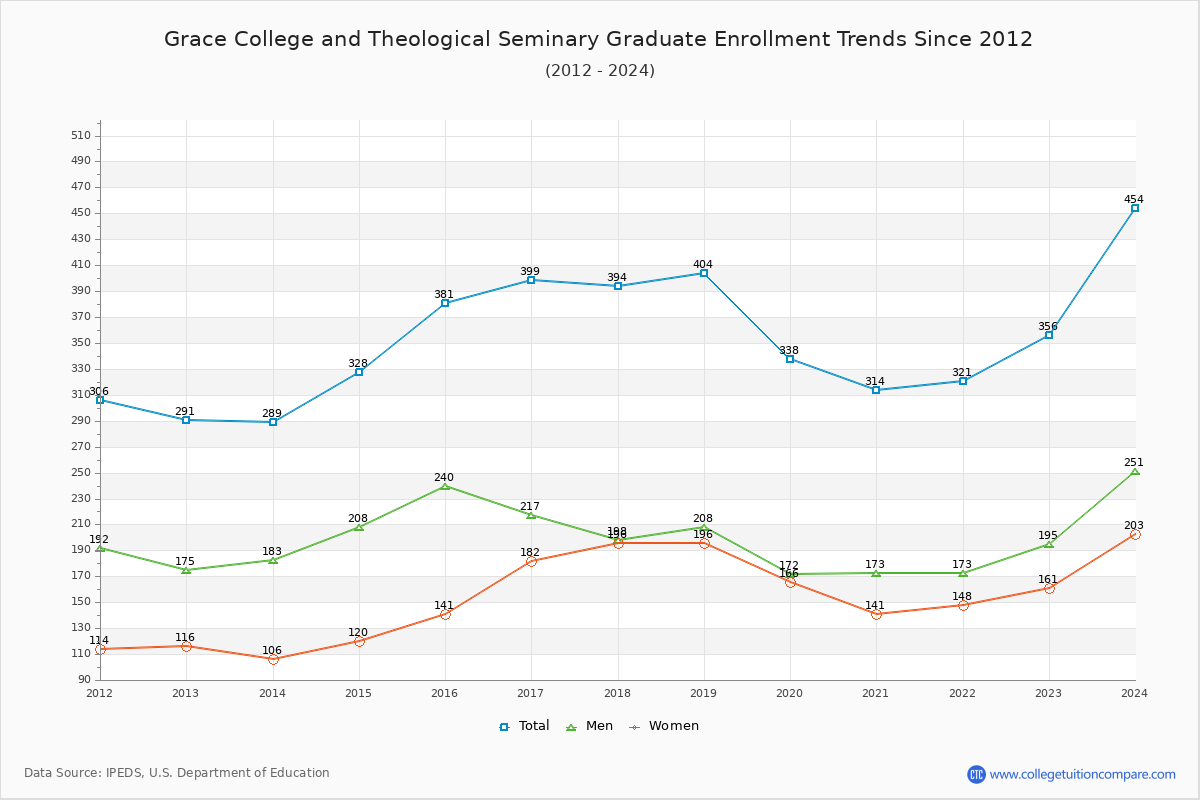
82.76% of total students is undergraduate students and 17.24% students is graduate students. The number of undergraduate students has increased by 179 and the graduate enrollment has increased by 65 over past 10 years.
The female to male ratio is 1.40 to 1 and it means that there are more female students enrolled in Grace College and Theological Seminary than male students.
The following table and chart illustrate the changes in student population by gender at Grace College and Theological Seminary since 2012.
| Year | Total | Undergraduate | Graduate | ||||
|---|---|---|---|---|---|---|---|
| Total | Men | Women | Total | Men | Women | ||
| 2012-13 | 1,821 | 1,530 | 655 | 875 | 291 | 175 | 116 |
| 2013-14 | 1,904 83 | 1,615 85 | 665 10 | 950 75 | 289 -2 | 183 8 | 106 -10 |
| 2014-15 | 2,185 281 | 1,857 242 | 841 176 | 1,016 66 | 328 39 | 208 25 | 120 14 |
| 2015-16 | 2,303 118 | 1,922 65 | 839 -2 | 1,083 67 | 381 53 | 240 32 | 141 21 |
| 2016-17 | 2,300 -3 | 1,901 -21 | 843 4 | 1,058 -25 | 399 18 | 217 -23 | 182 41 |
| 2017-18 | 2,156 -144 | 1,762 -139 | 710 -133 | 1,052 -6 | 394 -5 | 198 -19 | 196 14 |
| 2018-19 | 2,029 -127 | 1,625 -137 | 620 -90 | 1,005 -47 | 404 10 | 208 10 | 196 0 |
| 2019-20 | 1,957 -72 | 1,619 -6 | 626 6 | 993 -12 | 338 -66 | 172 -36 | 166 -30 |
| 2020-21 | 1,901 -56 | 1,587 -32 | 612 -14 | 975 -18 | 314 -24 | 173 1 | 141 -25 |
| 2021-22 | 1,919 18 | 1,598 11 | 609 -3 | 989 14 | 321 7 | 173 0 | 148 7 |
| 2022-23 | 2,065 146 | 1,709 111 | 666 57 | 1,043 54 | 356 35 | 195 22 | 161 13 |
| Average | 2,049 | 1,702 | 699 | 1,004 | 347 | 195 | 152 |