Enrollment Trends at Golden Gate

363

Total Enrollment

421

Men

-58

Women

The student population at Golden Gate University is 3,098 (271 undergraduate and 2,827 graduate students) . The number of students has increased by 363 over the past decade.

The percentage of undergraduate students at Golden Gate is 8.75% which is decreased by 187 over last 10 years. The graduate student population increased by 550 and it has been increasing.

The female to male ratio is 0.87 to 1 which means that male students enrolled slightly more than female students.

1,533 students enrolled in online degree program exclusively and the number of online students has increased by 70.33% since 2015.

Student Population Changes

The average student population over the last 11 years is 2,585 where 3,098 students are attending the school for the academic year 2024-2025.

8.75% of total students is undergraduate students and 91.25% students is graduate students. The number of undergraduate students has decreased by 187 and the graduate enrollment has increased by 550 over past 10 years.

The female to male ratio is 0.87 to 1 and it means that there are slightly more male students enrolled in Golden Gate than female students.

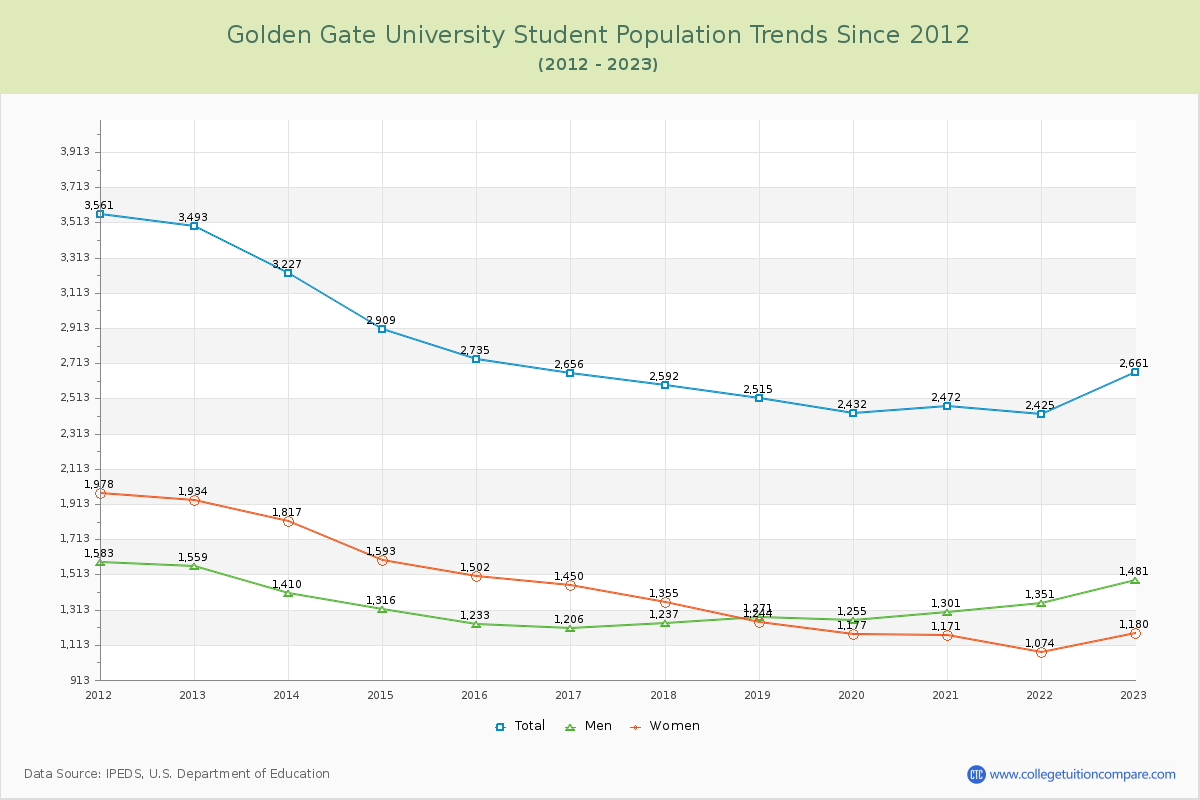
The following table and chart illustrate the changes in student population by gender at Golden Gate University since 2015.

YearTotalUndergraduateGraduate
TotalMenWomenTotalMenWomen
2015-162,7354582192392,2771,0141,263
2016-172,656
-79
445
-13
225
6
220
-19
2,211
-66
981
-33
1,230
-33
2017-182,592
-64
429
-16
246
21
183
-37
2,163
-48
991
10
1,172
-58
2018-192,515
-77
415
-14
269
23
146
-37
2,100
-63
1,002
11
1,098
-74
2019-202,432
-83
511
96
340
71
171
25
1,921
-179
915
-87
1,006
-92
2020-212,472
40
595
84
407
67
188
17
1,877
-44
894
-21
983
-23
2021-222,425
-47
691
96
501
94
190
2
1,734
-143
850
-44
884
-99
2022-232,661
236
601
-90
418
-83
183
-7
2,060
326
1,063
213
997
113
2023-242,262
-399
575
-26
353
-65
222
39
1,687
-373
1,068
5
619
-378
2024-253,098
836
271
-304
173
-180
98
-124
2,827
1,140
1,481
413
1,346
727
Average2,5854993151842,0861,0261,060
Golden Gate University Enrollment Trends Chart

Undergraduate Enrollment Changes

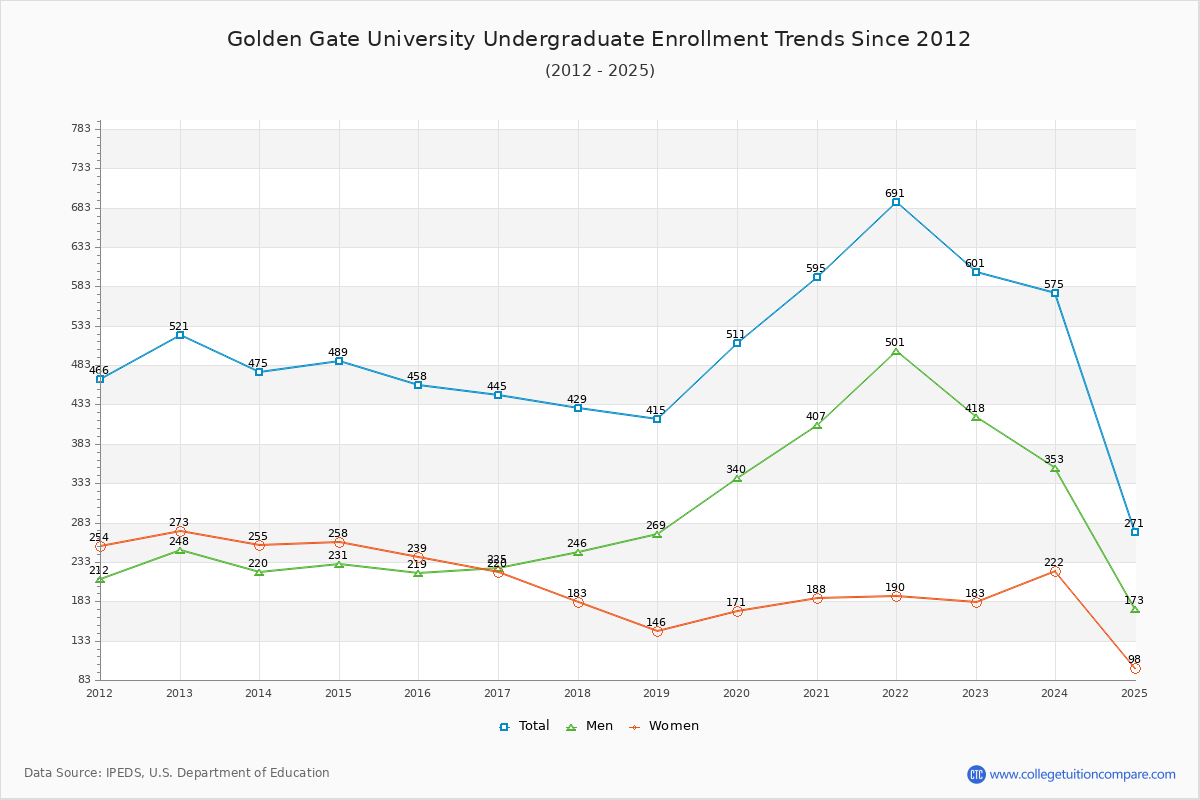
The average number of Undergraduate students over the last 11 years is 499 where 271 students are attending the Undergraduate school for the academic year 2024-2025. The following table and chart illustrate the changes in Undergraduate enrollment by attending status and gender at Golden Gate University since 2015.

YearTotalFull-timePart-time
TotalMenWomenTotalMenWomen
2015-164581459154313128185
2016-1744514910643296119177
2017-1842921214567217101116
2018-194152111634820410698
2019-2051126620957245131114
2020-215954293161131669175
2021-2269150338611718811573
2022-23601416324921859491
2023-2457528420480291149142
2024-25271141105361306862
Average49949920571499110113
Golden Gate University Undergraduate Enrollment Trends Chart

Graduate Enrollment Changes

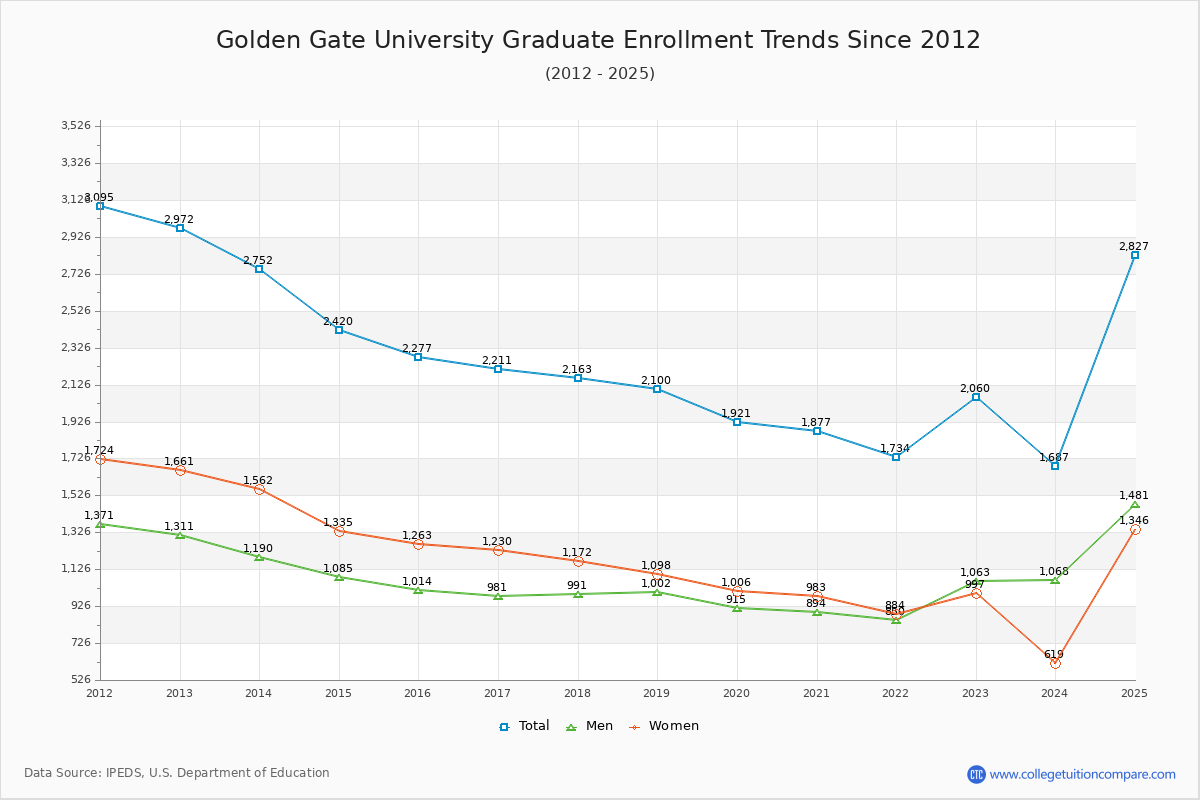
The average number of Graduate students over the last 11 years is 2,086 where 2,827 students are attending the Graduate school for the academic year 2024-2025. The following table and chart illustrate the changes in Graduate enrollment by attending status and gender at Golden Gate University since 2015.

YearTotalFull-timePart-time
TotalMenWomenTotalMenWomen
2015-162,2778343634711,443651792
2016-172,2118543515031,357630727
2017-182,1638233544691,340637703
2018-192,1008694074621,231595636
2019-201,9217753843911,146531615
2020-211,8777743883861,103506597
2021-221,734757382375977468509
2022-232,0601,293727566767336431
2023-241,6871,202808394485260225
2024-252,8272,4201,2721,148407209198
Average2,0862,0865445172,086482543
Golden Gate University Graduate Enrollment Trends Chart

Enrollment by Race/Ethnicity Changes

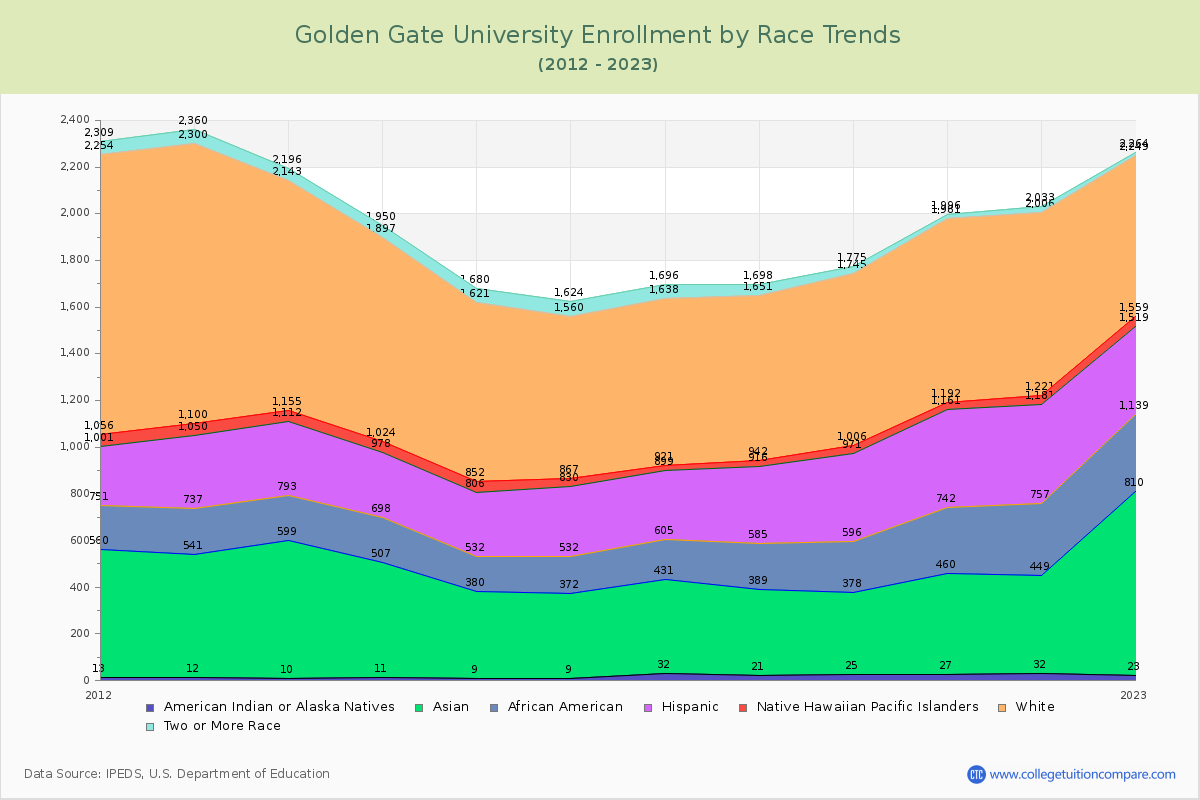
The percentage of white students is 12.49% and the percentage of black students is 7.55% at Golden Gate University. 46.61% of enrolled students is Asian. Hispanic students comprise 5.42% of the student body.

Over the past 10 years, the racial composition has shifted. The percentage of white students decreased from 28.12% to 12.49%. Asian enrollment grew from 13.56% to 46.61%. Black student enrollment increased from 5.56% to 7.55%. Hispanic student representation contracted from 10.02% to 5.42%.

The overall racial diversity, measured by the Census Bureau Diversity Index, is 0.7584 which indicates that quite diverse. This decreased from 0.8887 a decade ago, suggesting that racial diversity has declined.

The following table and chart illustrate the student population trends by race/ethnicity at Golden Gate University over the past 11 years (2015-2025).

YearAmerican Indian or Native AmericanAsianBlackHispanicNative Hawaiian or Other Pacific IslanderWhiteTwo or More Races
2015-1693711522744676959
2016-1793631602983769364
2017-18323991742942271758
2018-19213681963312670947
2019-20253532183753573930
2020-21274332824193178915
2021-22324173084244078527
2022-23237873293804069015
2023-2422647223230224442
2024-25121,444234168233872
Average215582283193267232
Golden Gate University Enrollment by Race Trends Chart

Distance Learning (Online Courses) Enrollment Changes

1,533 students are enrolled in online degree programs exclusively for the academic year 2024-2025, which is 50% of total students. The number of online students has increased 70.33% since 2015. The following table and chart illustrate the changes in the online student population by enrolled type at Golden Gate University from 2015 to 2025.

YearTotal EnrollmentOnline CompletelyEnrolled in Some Online CoursesNot Enrolled in Online Courses
2015-162,7359005881,247
2016-172,6568686891,099
2017-182,5929185071,167
2018-192,5157844761,255
2019-202,432813818801
2020-212,4725141,145813
2021-222,4253251,0271,073
2022-232,661769958934
2023-242,2621,76047329
2024-253,0981,5334291,136
Average2,585918711955

Ratings & Review

Share your experiences and thoughts about Golden Gate University. It will be a great help to applicants and prospective students!