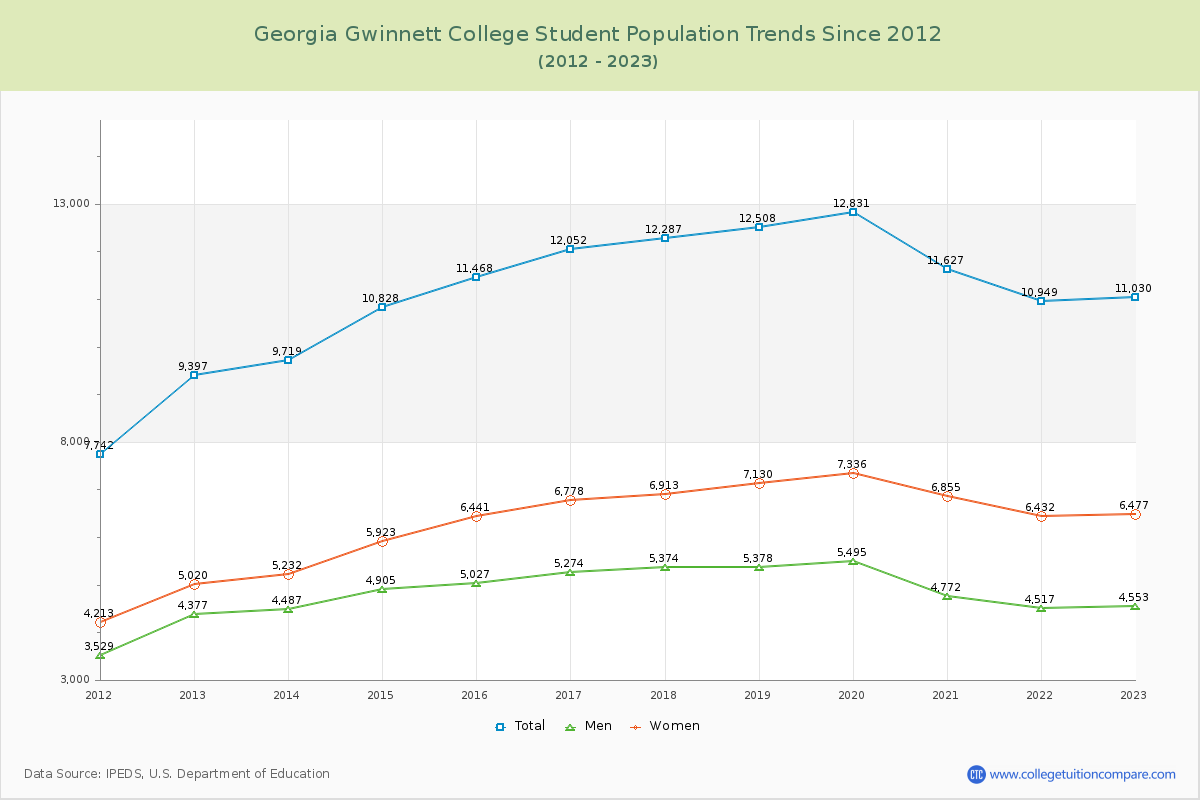
Student Population Changes
The average student population over the last 12 years is 11,336 where 11,030 students are attending the school for the academic year 2022-2023.
The female to male ratio is 1.42 to 1 and it means that there are more female students enrolled in Georgia Gwinnett than male students.
The following table and chart illustrate the changes in student population by gender at Georgia Gwinnett College since 2012.
| Year | Total | Men | Women |
|---|---|---|---|
| 2012-13 | 9,397 | 4,377 | 5,020 |
| 2013-14 | 9,719 322 | 4,487 110 | 5,232 212 |
| 2014-15 | 10,828 1,109 | 4,905 418 | 5,923 691 |
| 2015-16 | 11,468 640 | 5,027 122 | 6,441 518 |
| 2016-17 | 12,052 584 | 5,274 247 | 6,778 337 |
| 2017-18 | 12,287 235 | 5,374 100 | 6,913 135 |
| 2018-19 | 12,508 221 | 5,378 4 | 7,130 217 |
| 2019-20 | 12,831 323 | 5,495 117 | 7,336 206 |
| 2020-21 | 11,627 -1,204 | 4,772 -723 | 6,855 -481 |
| 2021-22 | 10,949 -678 | 4,517 -255 | 6,432 -423 |
| 2022-23 | 11,030 81 | 4,553 36 | 6,477 45 |
| Average | 11,336 | 4,924 | 6,412 |