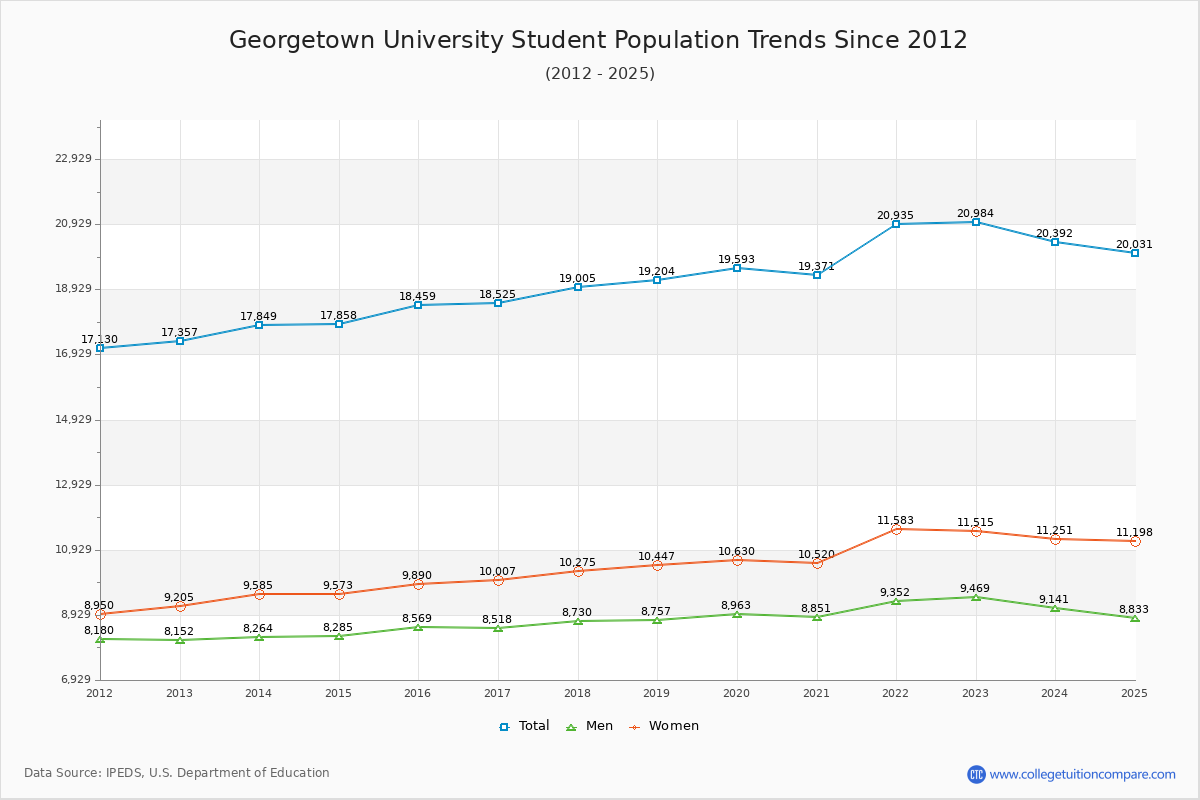
Student Population Changes
The average student population over the last 12 years is 19,013 where 20,984 students are attending the school for the academic year 2022-2023.
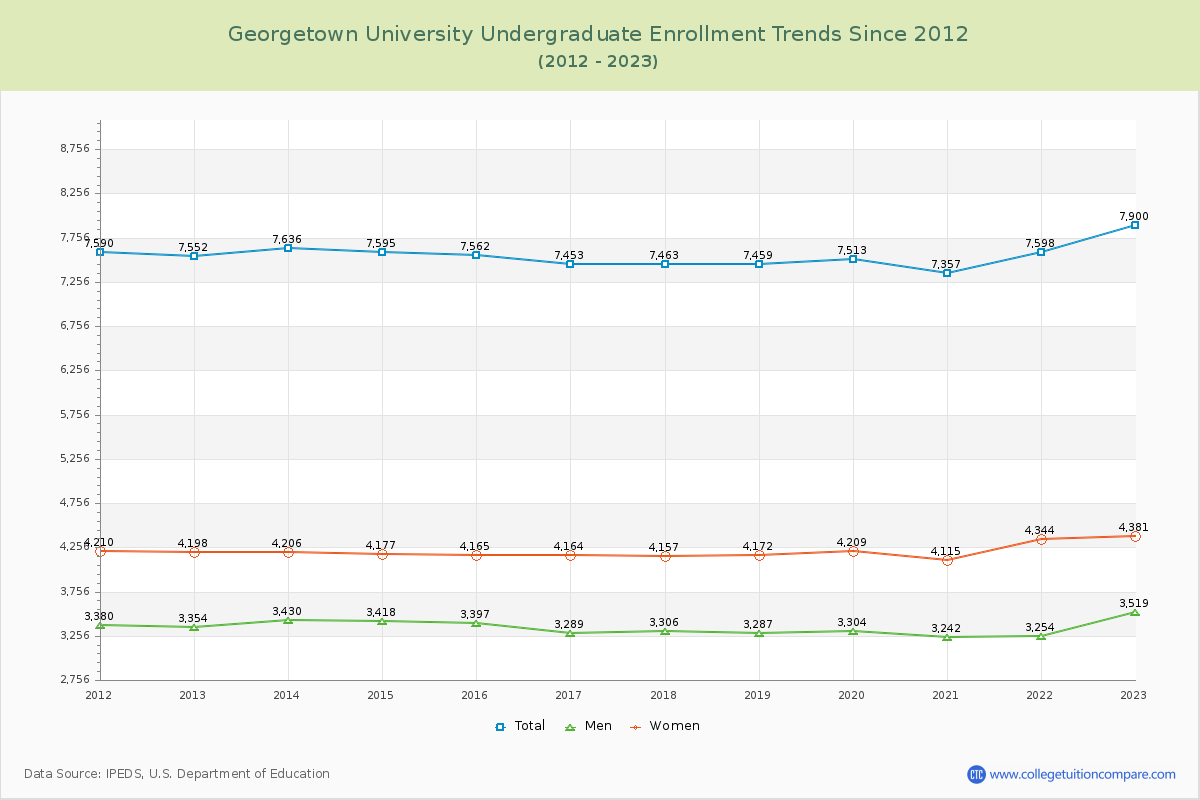
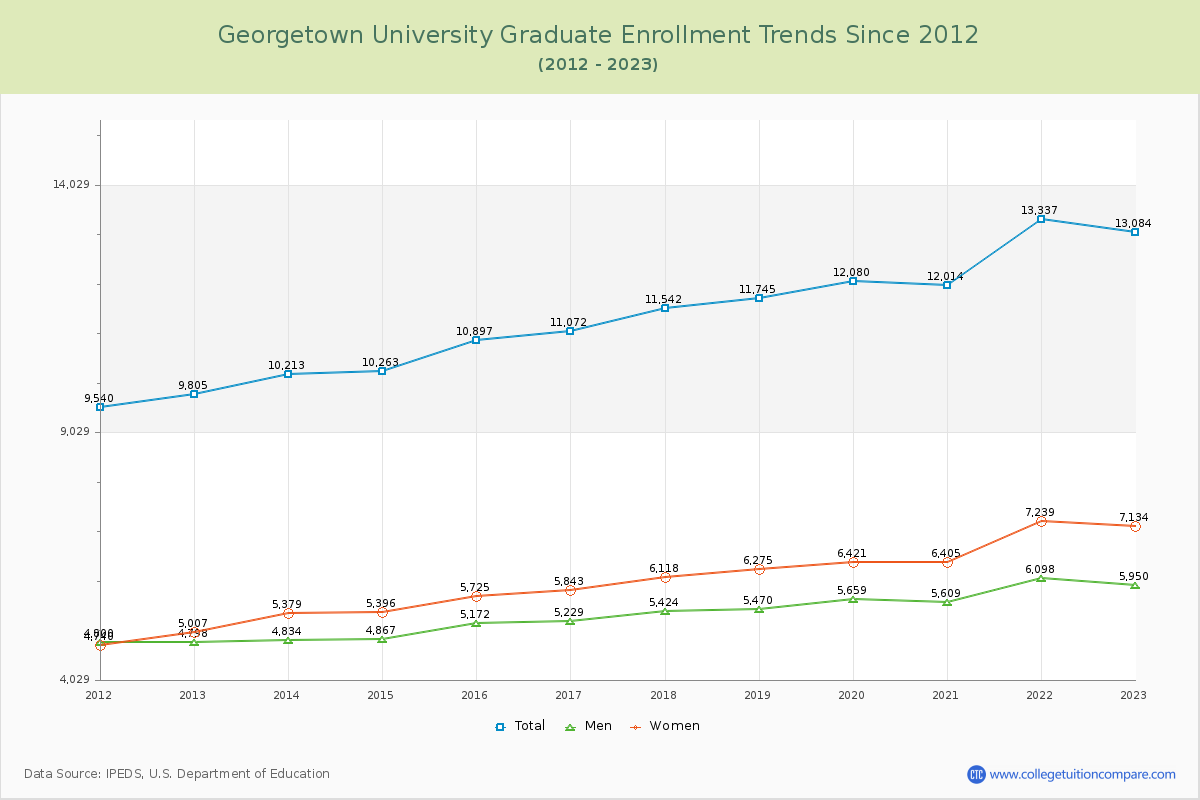
37.65% of total students is undergraduate students and 62.35% students is graduate students. The number of undergraduate students has increased by 348 and the graduate enrollment has increased by 3,279 over past 10 years.
The female to male ratio is 1.22 to 1 and it means that there are slightly more female students enrolled in GU than male students.
The following table and chart illustrate the changes in student population by gender at Georgetown University since 2012.
| Year | Total | Undergraduate | Graduate | ||||
|---|---|---|---|---|---|---|---|
| Total | Men | Women | Total | Men | Women | ||
| 2012-13 | 17,357 | 7,552 | 3,354 | 4,198 | 9,805 | 4,798 | 5,007 |
| 2013-14 | 17,849 492 | 7,636 84 | 3,430 76 | 4,206 8 | 10,213 408 | 4,834 36 | 5,379 372 |
| 2014-15 | 17,858 9 | 7,595 -41 | 3,418 -12 | 4,177 -29 | 10,263 50 | 4,867 33 | 5,396 17 |
| 2015-16 | 18,459 601 | 7,562 -33 | 3,397 -21 | 4,165 -12 | 10,897 634 | 5,172 305 | 5,725 329 |
| 2016-17 | 18,525 66 | 7,453 -109 | 3,289 -108 | 4,164 -1 | 11,072 175 | 5,229 57 | 5,843 118 |
| 2017-18 | 19,005 480 | 7,463 10 | 3,306 17 | 4,157 -7 | 11,542 470 | 5,424 195 | 6,118 275 |
| 2018-19 | 19,204 199 | 7,459 -4 | 3,287 -19 | 4,172 15 | 11,745 203 | 5,470 46 | 6,275 157 |
| 2019-20 | 19,593 389 | 7,513 54 | 3,304 17 | 4,209 37 | 12,080 335 | 5,659 189 | 6,421 146 |
| 2020-21 | 19,371 -222 | 7,357 -156 | 3,242 -62 | 4,115 -94 | 12,014 -66 | 5,609 -50 | 6,405 -16 |
| 2021-22 | 20,935 1,564 | 7,598 241 | 3,254 12 | 4,344 229 | 13,337 1,323 | 6,098 489 | 7,239 834 |
| 2022-23 | 20,984 49 | 7,900 302 | 3,519 265 | 4,381 37 | 13,084 -253 | 5,950 -148 | 7,134 -105 |
| Average | 19,013 | 7,553 | 3,345 | 4,208 | 11,459 | 5,374 | 6,086 |