Enrollment Trends at Garrett-Evangelical Theological Seminary

-24

Total Enrollment

-16

Men

-8

Women

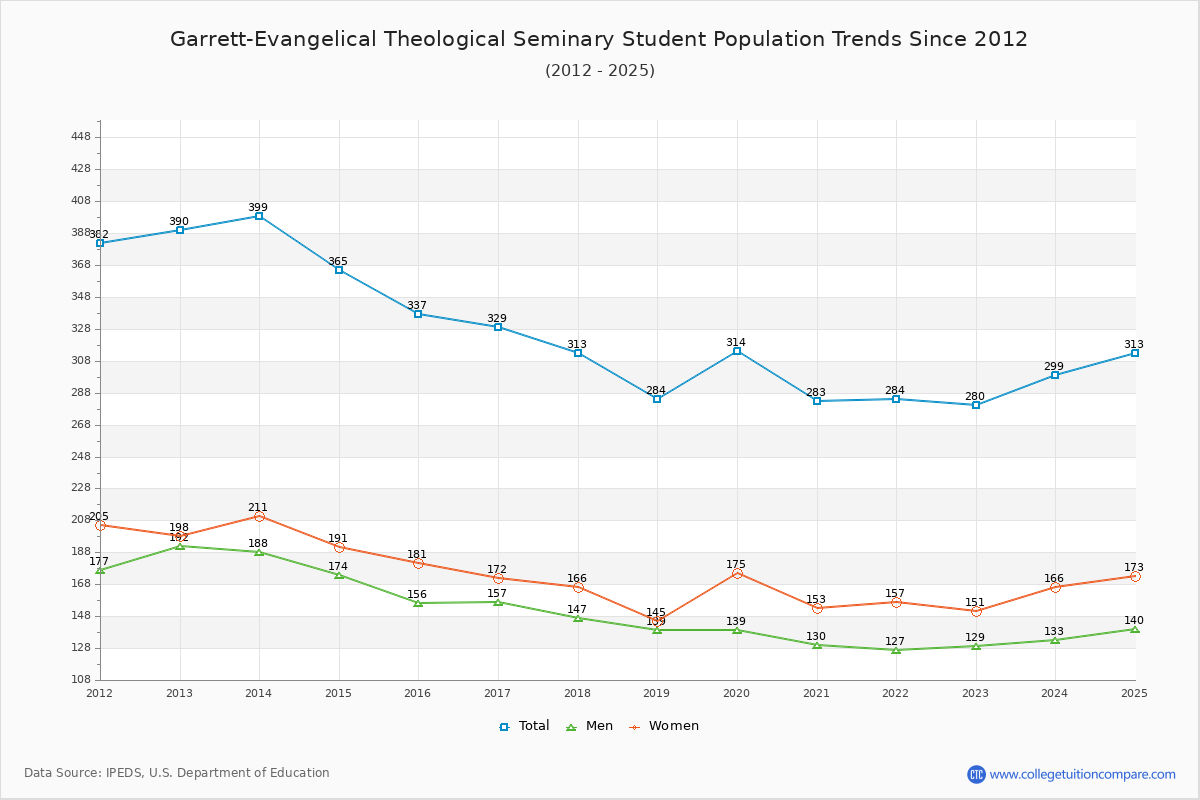
The student population at Garrett-Evangelical Theological Seminary is 313 (all graduate). The number of students has decreased by 24 over the past decade.

The female to male ratio is 1.24 to 1 which means that female students enrolled slightly more than male students.

88 students enrolled in online degree program exclusively and the number of online students has increased by 104.65% since 2015.

Student Population Changes

The average student population over the last 11 years is 304 where 313 students are attending the school for the academic year 2024-2025.

The female to male ratio is 1.24 to 1 and it means that there are slightly more female students enrolled in Garrett-Evangelical Theological Seminary than male students.

The following table and chart illustrate the changes in student population by gender at Garrett-Evangelical Theological Seminary since 2015.

YearTotalMenWomen
2015-16337156181
2016-17329
-8
157
1
172
-9
2017-18313
-16
147
-10
166
-6
2018-19284
-29
139
-8
145
-21
2019-20314
30
139175
30
2020-21283
-31
130
-9
153
-22
2021-22284
1
127
-3
157
4
2022-23280
-4
129
2
151
-6
2023-24299
19
133
4
166
15
2024-25313
14
140
7
173
7
Average304140164
Garrett-Evangelical Theological Seminary Enrollment Trends Chart

Enrollment by Race/Ethnicity Changes

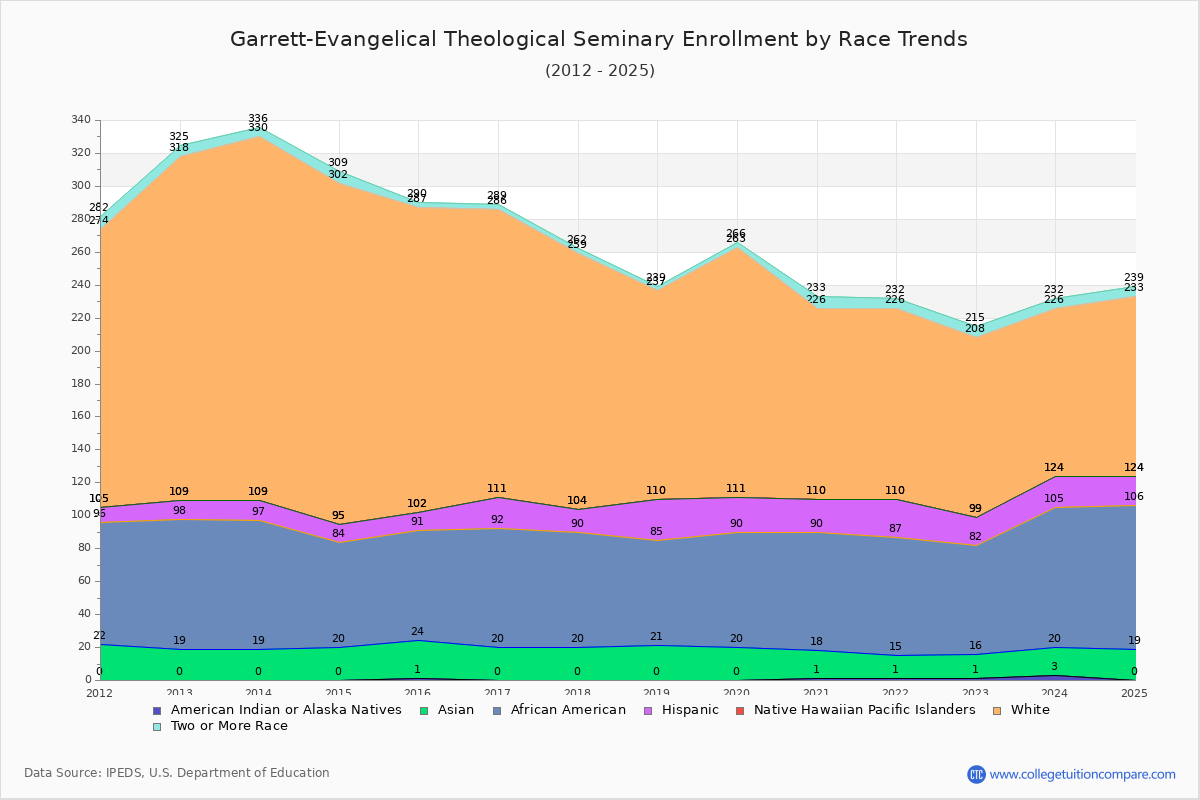
The percentage of white students is 34.82% and the percentage of black students is 27.80% at Garrett-Evangelical Theological Seminary. 6.07% of enrolled students is Asian. Hispanic students comprise 5.75% of the student body.

Over the past 10 years, the racial composition has shifted. The percentage of white students decreased from 54.90% to 34.82%. Asian enrollment declined from 6.82% to 6.07%. Black student enrollment increased from 19.88% to 27.80%. Hispanic student representation expanded from 3.26% to 5.75%.

The overall racial diversity, measured by the Census Bureau Diversity Index, is 0.7941 which indicates that quite diverse. This increased from 0.6533 a decade ago, suggesting that racial diversity has improved.

The following table and chart illustrate the student population trends by race/ethnicity at Garrett-Evangelical Theological Seminary over the past 11 years (2015-2025).

YearAmerican Indian or Native AmericanAsianBlackHispanicNative Hawaiian or Other Pacific IslanderWhiteTwo or More Races
2015-16123671101853
2016-17020721901753
2017-18020701401553
2018-19021642501272
2019-20020702101523
2020-21117722001167
2021-22114722301166
2022-23115661701097
2023-24317851901026
2024-25019871801096
Average119731901355
Garrett-Evangelical Theological Seminary Enrollment by Race Trends Chart

Distance Learning (Online Courses) Enrollment Changes

88 students are enrolled in online degree programs exclusively for the academic year 2024-2025, which is 28% of total students. The number of online students has increased 104.65% since 2015. The following table and chart illustrate the changes in the online student population by enrolled type at Garrett-Evangelical Theological Seminary from 2015 to 2025.

YearTotal EnrollmentOnline CompletelyEnrolled in Some Online CoursesNot Enrolled in Online Courses
2015-1633743120174
2016-1732946113170
2017-183133682195
2018-192845079155
2019-2031452118144
2020-2128312112159
2021-222844418060
2022-232804816270
2023-2429963126110
2024-253138812699
Average30448122134

Ratings & Review

Share your experiences and thoughts about Garrett-Evangelical Theological Seminary. It will be a great help to applicants and prospective students!