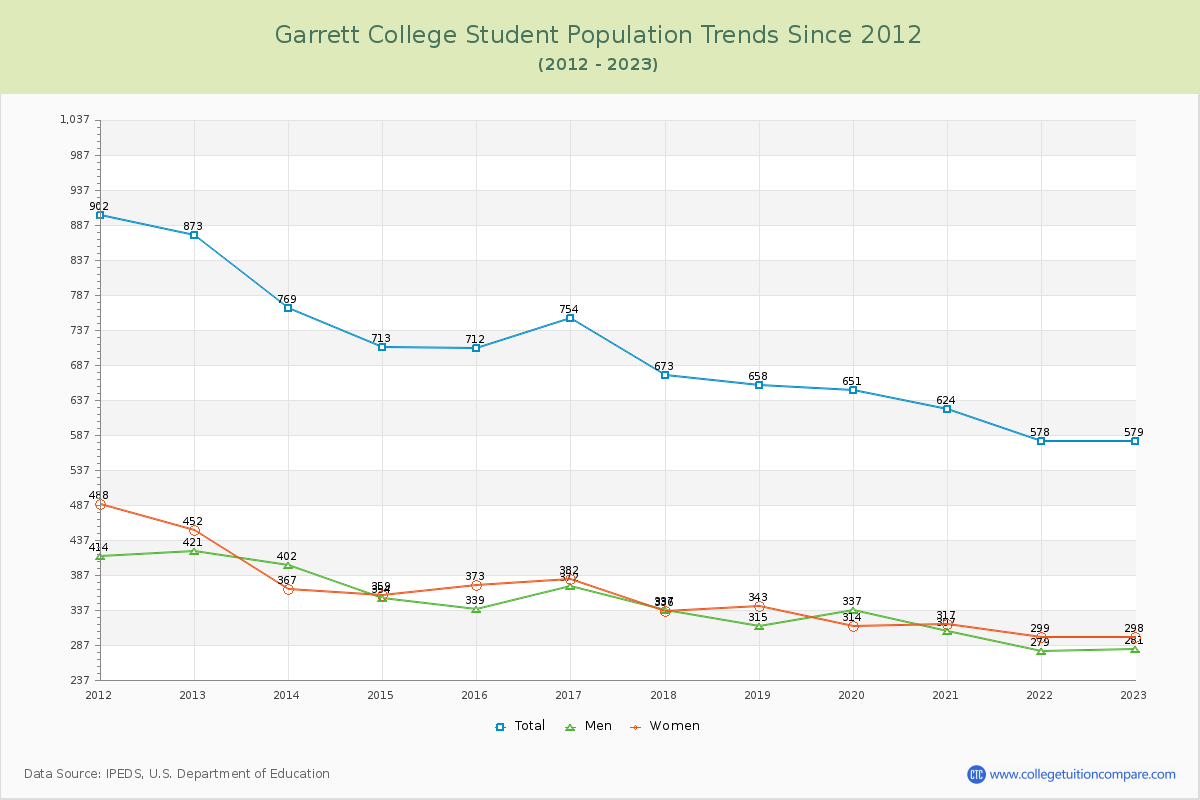
Student Population Changes
The average student population over the last 12 years is 689 where 579 students are attending the school for the academic year 2022-2023.
The female to male ratio is 1.06 to 1 and it means that there are similar numbers of female and male students enrolled in GC.
The following table and chart illustrate the changes in student population by gender at Garrett College since 2012.
| Year | Total | Men | Women |
|---|---|---|---|
| 2012-13 | 873 | 421 | 452 |
| 2013-14 | 769 -104 | 402 -19 | 367 -85 |
| 2014-15 | 713 -56 | 354 -48 | 359 -8 |
| 2015-16 | 712 -1 | 339 -15 | 373 14 |
| 2016-17 | 754 42 | 372 33 | 382 9 |
| 2017-18 | 673 -81 | 337 -35 | 336 -46 |
| 2018-19 | 658 -15 | 315 -22 | 343 7 |
| 2019-20 | 651 -7 | 337 22 | 314 -29 |
| 2020-21 | 624 -27 | 307 -30 | 317 3 |
| 2021-22 | 578 -46 | 279 -28 | 299 -18 |
| 2022-23 | 579 1 | 281 2 | 298 -1 |
| Average | 689 | 340 | 349 |