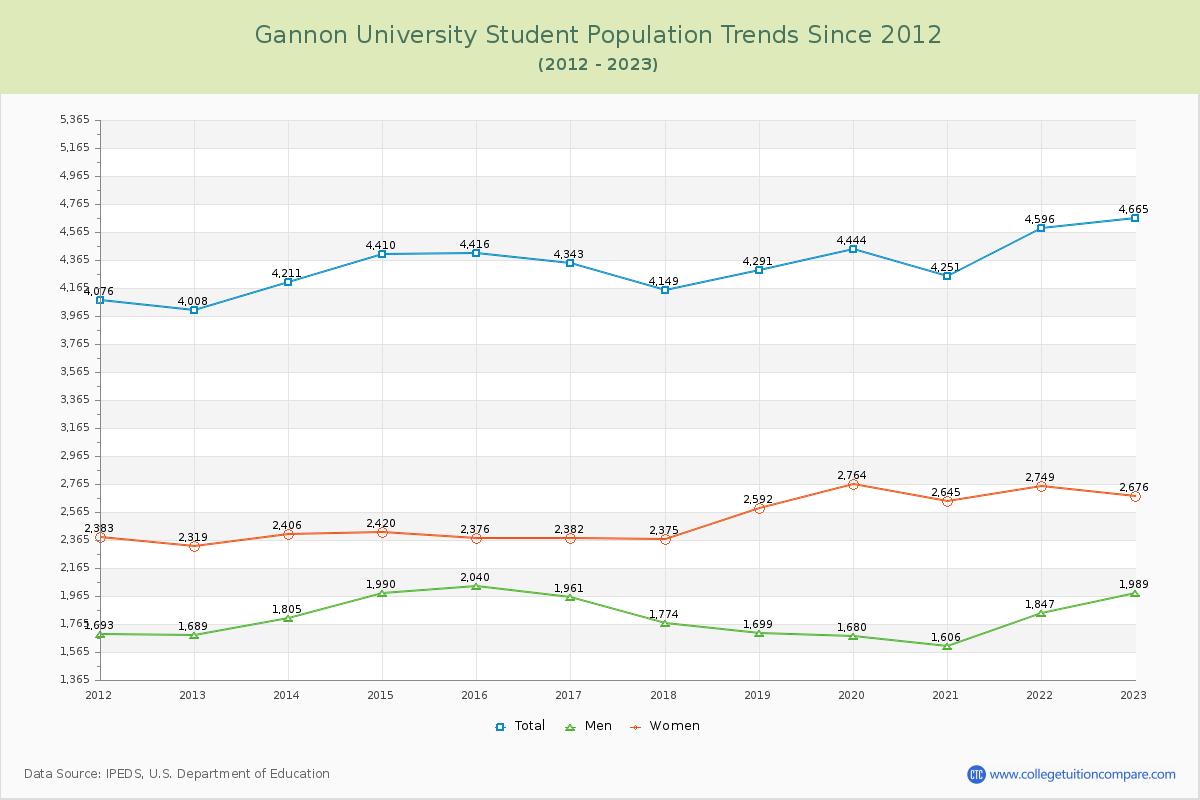
Student Population Changes
The average student population over the last 12 years is 4,344 where 4,665 students are attending the school for the academic year 2022-2023.
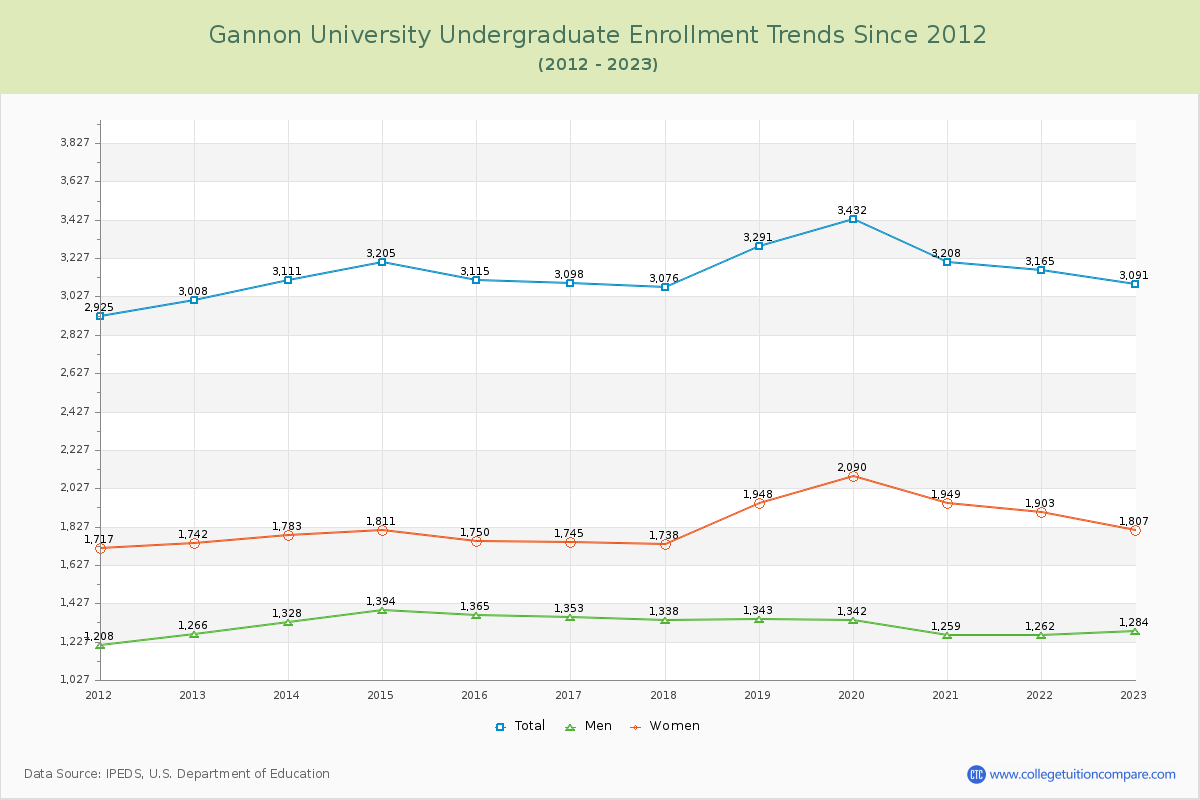
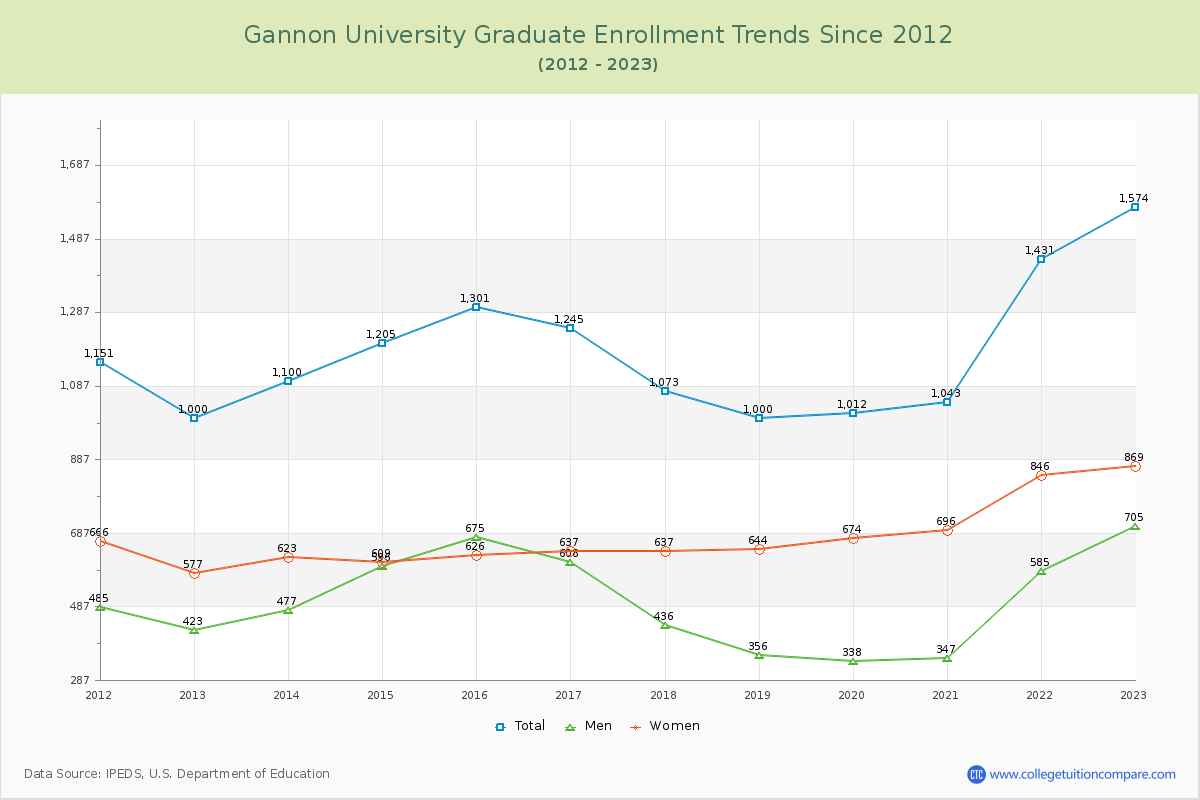
66.26% of total students is undergraduate students and 33.74% students is graduate students. The number of undergraduate students has increased by 83 and the graduate enrollment has increased by 574 over past 10 years.
The female to male ratio is 1.35 to 1 and it means that there are more female students enrolled in Gannon than male students.
The following table and chart illustrate the changes in student population by gender at Gannon University since 2012.
| Year | Total | Undergraduate | Graduate | ||||
|---|---|---|---|---|---|---|---|
| Total | Men | Women | Total | Men | Women | ||
| 2012-13 | 4,008 | 3,008 | 1,266 | 1,742 | 1,000 | 423 | 577 |
| 2013-14 | 4,211 203 | 3,111 103 | 1,328 62 | 1,783 41 | 1,100 100 | 477 54 | 623 46 |
| 2014-15 | 4,410 199 | 3,205 94 | 1,394 66 | 1,811 28 | 1,205 105 | 596 119 | 609 -14 |
| 2015-16 | 4,416 6 | 3,115 -90 | 1,365 -29 | 1,750 -61 | 1,301 96 | 675 79 | 626 17 |
| 2016-17 | 4,343 -73 | 3,098 -17 | 1,353 -12 | 1,745 -5 | 1,245 -56 | 608 -67 | 637 11 |
| 2017-18 | 4,149 -194 | 3,076 -22 | 1,338 -15 | 1,738 -7 | 1,073 -172 | 436 -172 | 637 0 |
| 2018-19 | 4,291 142 | 3,291 215 | 1,343 5 | 1,948 210 | 1,000 -73 | 356 -80 | 644 7 |
| 2019-20 | 4,444 153 | 3,432 141 | 1,342 -1 | 2,090 142 | 1,012 12 | 338 -18 | 674 30 |
| 2020-21 | 4,251 -193 | 3,208 -224 | 1,259 -83 | 1,949 -141 | 1,043 31 | 347 9 | 696 22 |
| 2021-22 | 4,596 345 | 3,165 -43 | 1,262 3 | 1,903 -46 | 1,431 388 | 585 238 | 846 150 |
| 2022-23 | 4,665 69 | 3,091 -74 | 1,284 22 | 1,807 -96 | 1,574 143 | 705 120 | 869 23 |
| Average | 4,344 | 3,164 | 1,321 | 1,842 | 1,180 | 504 | 676 |