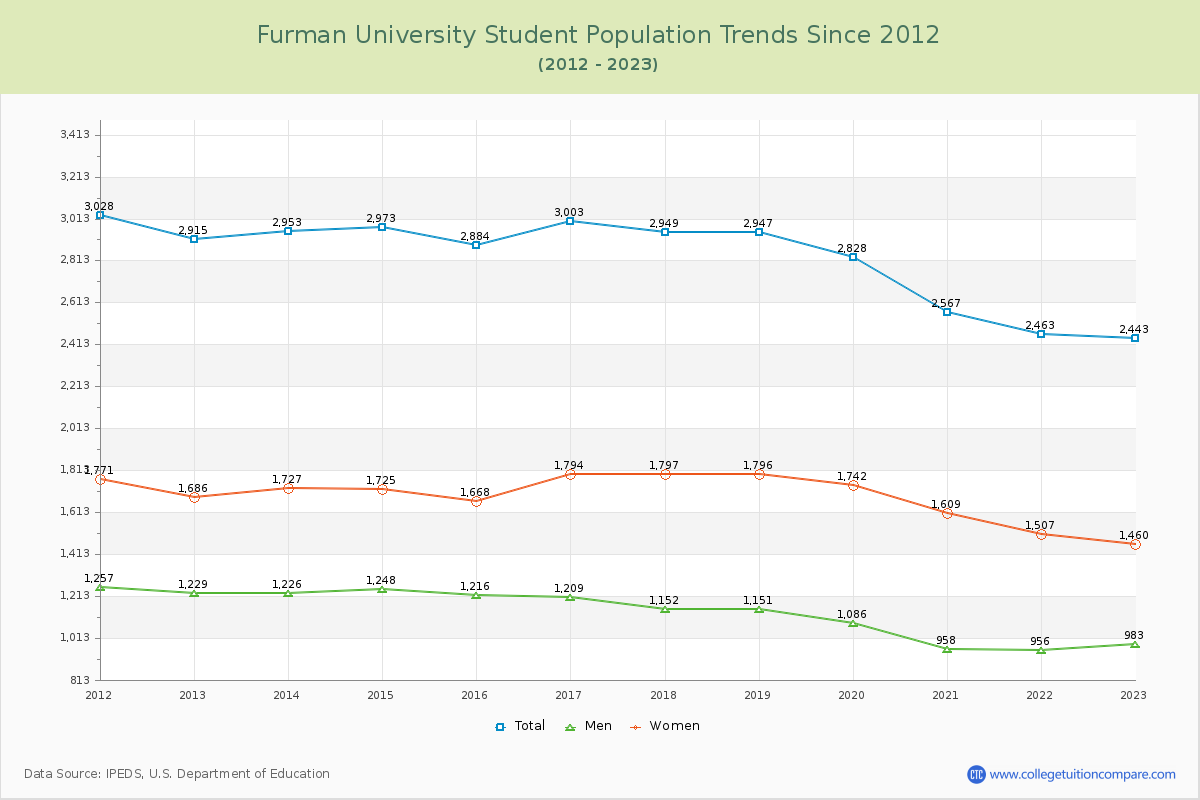
Student Population Changes
The average student population over the last 12 years is 2,811 where 2,443 students are attending the school for the academic year 2022-2023.
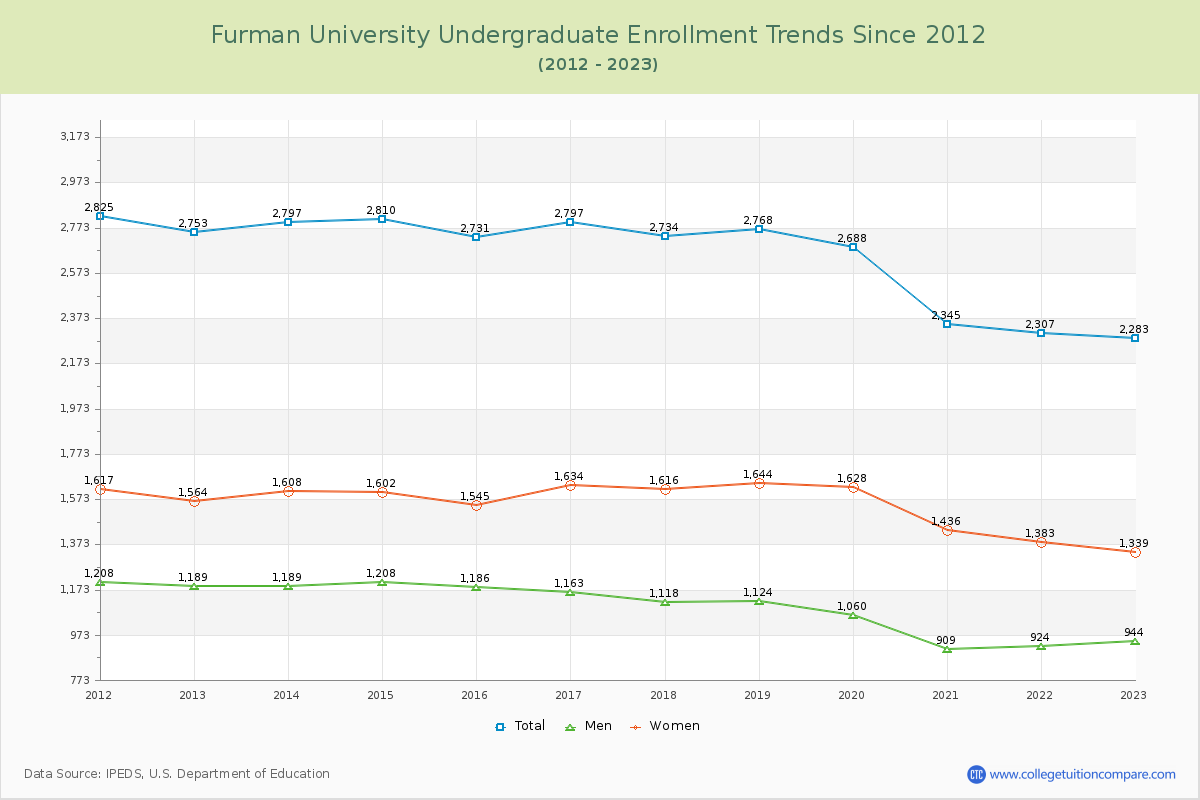
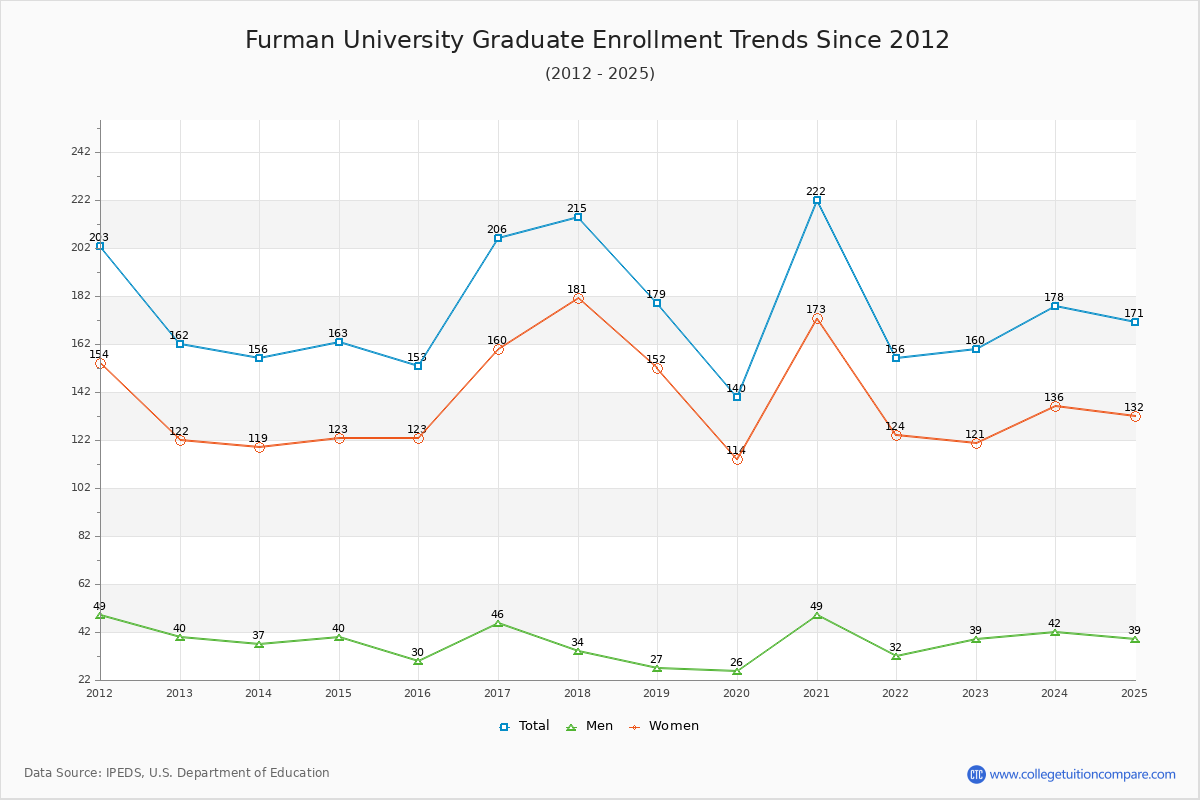
93.45% of total students is undergraduate students and 6.55% students is graduate students. The number of undergraduate students has decreased by 470 and the graduate enrollment has decreased by 2 over past 10 years.
The female to male ratio is 1.49 to 1 and it means that there are more female students enrolled in Furman than male students.
The following table and chart illustrate the changes in student population by gender at Furman University since 2012.
| Year | Total | Undergraduate | Graduate | ||||
|---|---|---|---|---|---|---|---|
| Total | Men | Women | Total | Men | Women | ||
| 2012-13 | 2,915 | 2,753 | 1,189 | 1,564 | 162 | 40 | 122 |
| 2013-14 | 2,953 38 | 2,797 44 | 1,189 0 | 1,608 44 | 156 -6 | 37 -3 | 119 -3 |
| 2014-15 | 2,973 20 | 2,810 13 | 1,208 19 | 1,602 -6 | 163 7 | 40 3 | 123 4 |
| 2015-16 | 2,884 -89 | 2,731 -79 | 1,186 -22 | 1,545 -57 | 153 -10 | 30 -10 | 123 0 |
| 2016-17 | 3,003 119 | 2,797 66 | 1,163 -23 | 1,634 89 | 206 53 | 46 16 | 160 37 |
| 2017-18 | 2,949 -54 | 2,734 -63 | 1,118 -45 | 1,616 -18 | 215 9 | 34 -12 | 181 21 |
| 2018-19 | 2,947 -2 | 2,768 34 | 1,124 6 | 1,644 28 | 179 -36 | 27 -7 | 152 -29 |
| 2019-20 | 2,828 -119 | 2,688 -80 | 1,060 -64 | 1,628 -16 | 140 -39 | 26 -1 | 114 -38 |
| 2020-21 | 2,567 -261 | 2,345 -343 | 909 -151 | 1,436 -192 | 222 82 | 49 23 | 173 59 |
| 2021-22 | 2,463 -104 | 2,307 -38 | 924 15 | 1,383 -53 | 156 -66 | 32 -17 | 124 -49 |
| 2022-23 | 2,443 -20 | 2,283 -24 | 944 20 | 1,339 -44 | 160 4 | 39 7 | 121 -3 |
| Average | 2,811 | 2,638 | 1,092 | 1,545 | 174 | 36 | 137 |