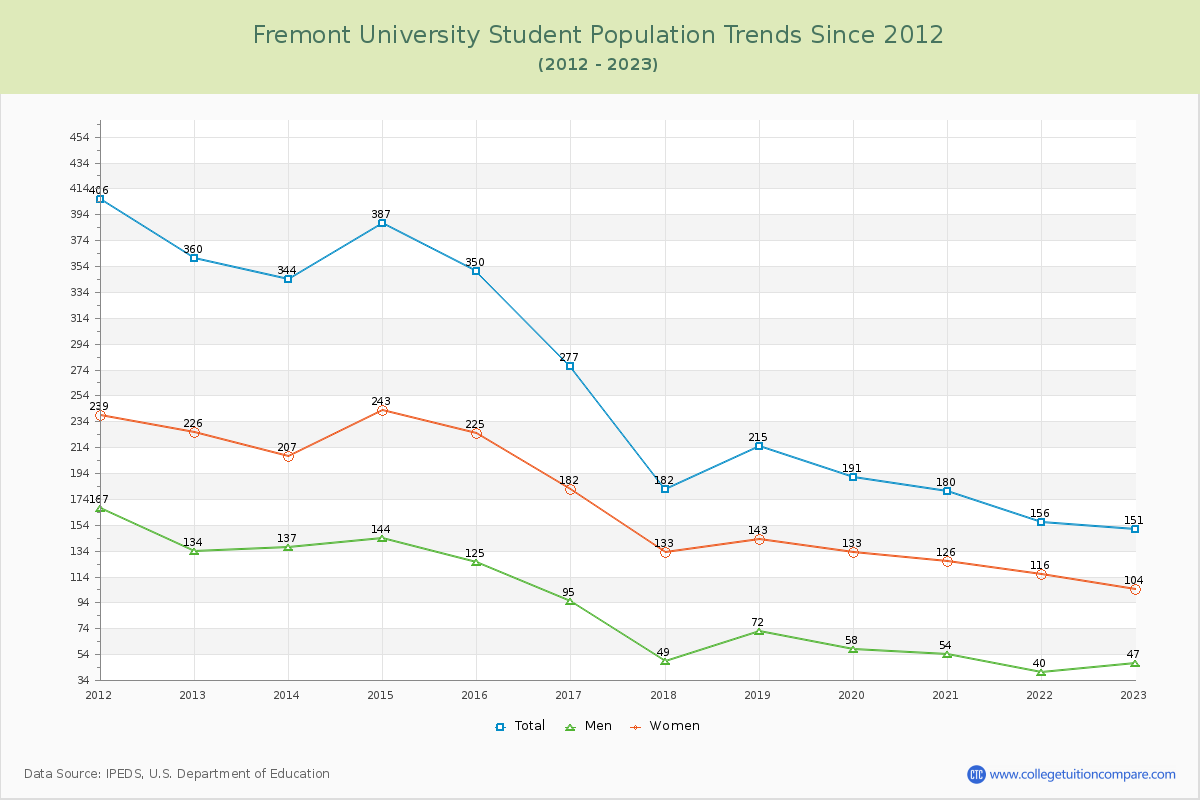
Student Population Changes
The average student population over the last 12 years is 254 where 151 students are attending the school for the academic year 2022-2023.
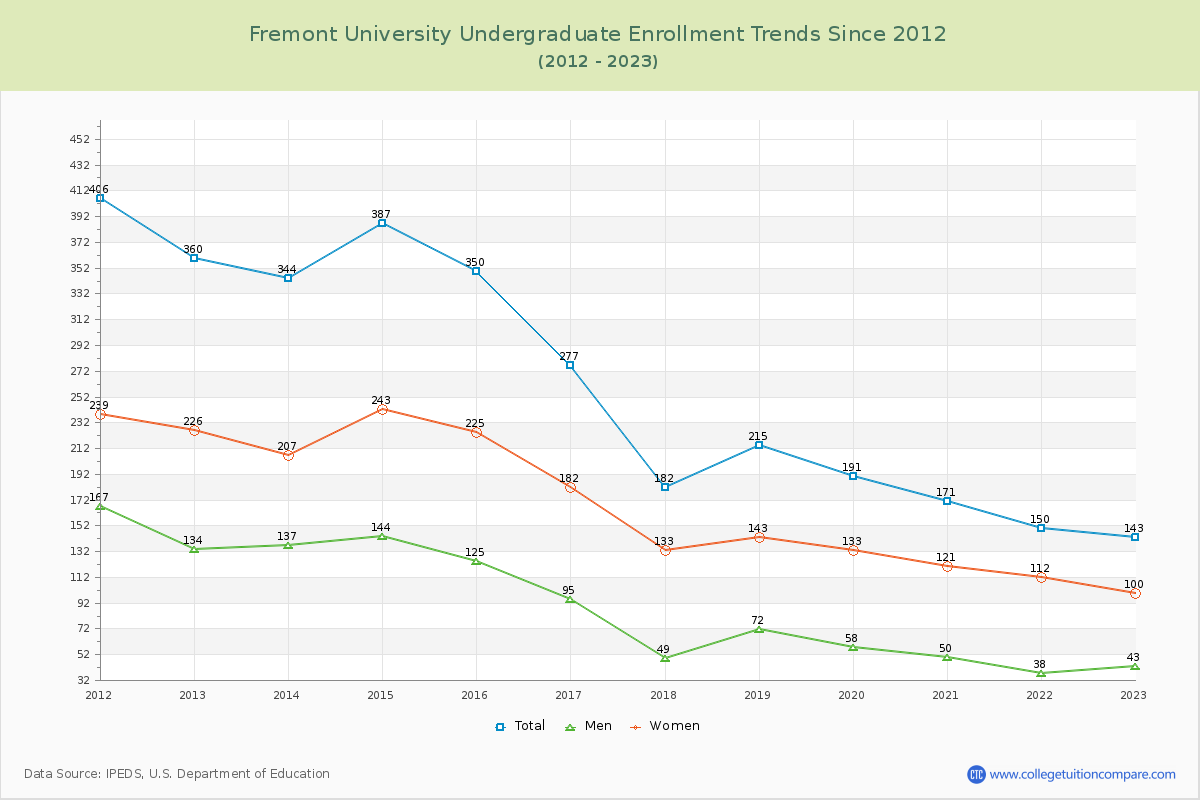
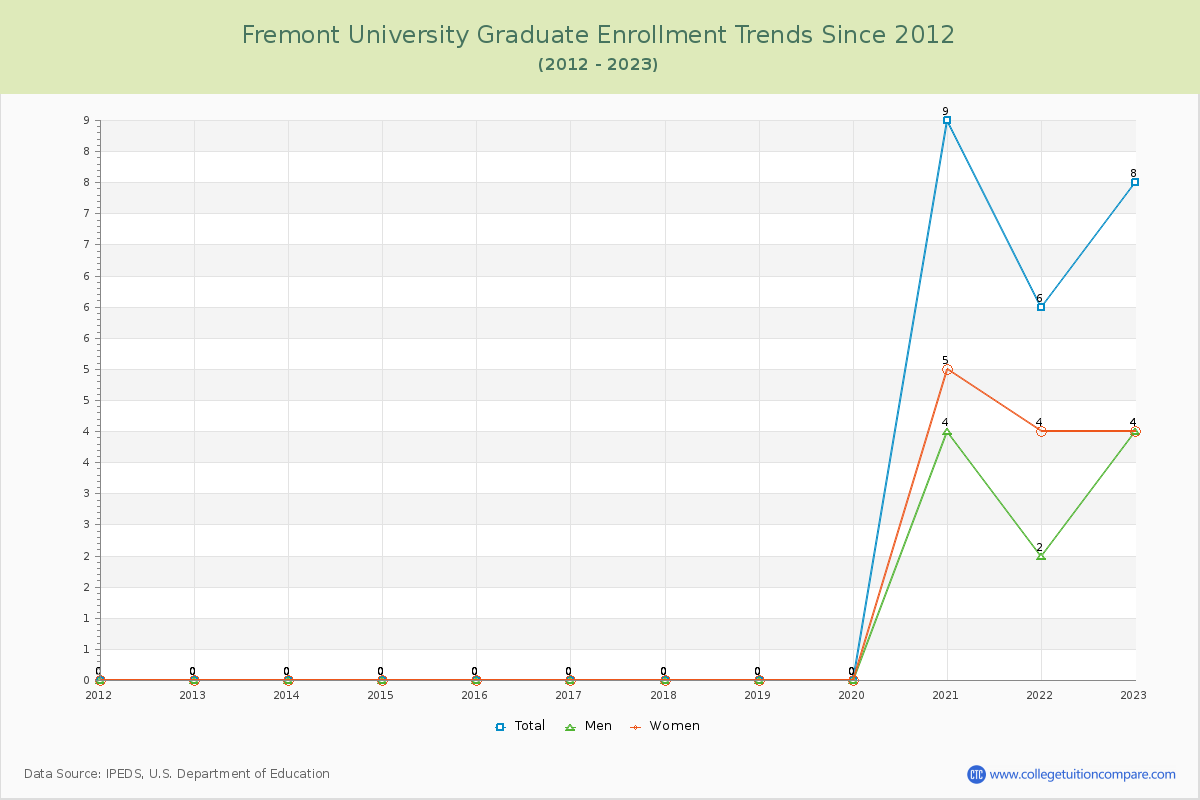
94.70% of total students is undergraduate students and 5.30% students is graduate students. The number of undergraduate students has decreased by 217 and the graduate enrollment has increased by 8 over past 10 years.
The female to male ratio is 2.21 to 1 and it means that there are far more female students enrolled in Fremont than male students.
The following table and chart illustrate the changes in student population by gender at Fremont University since 2012.
| Year | Total | Undergraduate | Graduate | ||||
|---|---|---|---|---|---|---|---|
| Total | Men | Women | Total | Men | Women | ||
| 2012-13 | 360 | 360 | 134 | 226 | 0 | 0 | 0 |
| 2013-14 | 344 -16 | 344 -16 | 137 3 | 207 -19 | 0 0 | 0 0 | 0 0 |
| 2014-15 | 387 43 | 387 43 | 144 7 | 243 36 | 0 0 | 0 0 | 0 0 |
| 2015-16 | 350 -37 | 350 -37 | 125 -19 | 225 -18 | 0 0 | 0 0 | 0 0 |
| 2016-17 | 277 -73 | 277 -73 | 95 -30 | 182 -43 | 0 0 | 0 0 | 0 0 |
| 2017-18 | 182 -95 | 182 -95 | 49 -46 | 133 -49 | 0 0 | 0 0 | 0 0 |
| 2018-19 | 215 33 | 215 33 | 72 23 | 143 10 | 0 0 | 0 0 | 0 0 |
| 2019-20 | 191 -24 | 191 -24 | 58 -14 | 133 -10 | 0 0 | 0 0 | 0 0 |
| 2020-21 | 180 -11 | 171 -20 | 50 -8 | 121 -12 | 9 9 | 4 4 | 5 5 |
| 2021-22 | 156 -24 | 150 -21 | 38 -12 | 112 -9 | 6 -3 | 2 -2 | 4 -1 |
| 2022-23 | 151 -5 | 143 -7 | 43 5 | 100 -12 | 8 2 | 4 2 | 4 0 |
| Average | 254 | 252 | 86 | 166 | 2 | 1 | 1 |