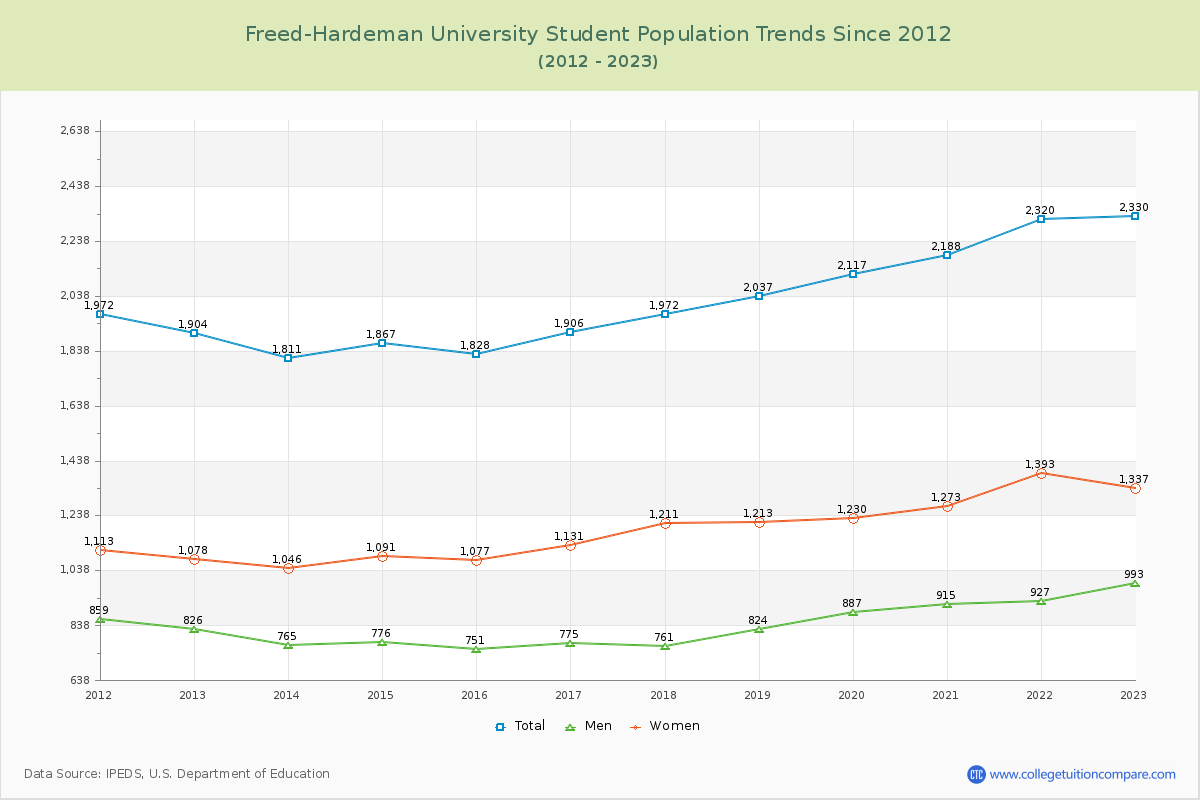
Student Population Changes
The average student population over the last 12 years is 2,025 where 2,330 students are attending the school for the academic year 2022-2023.
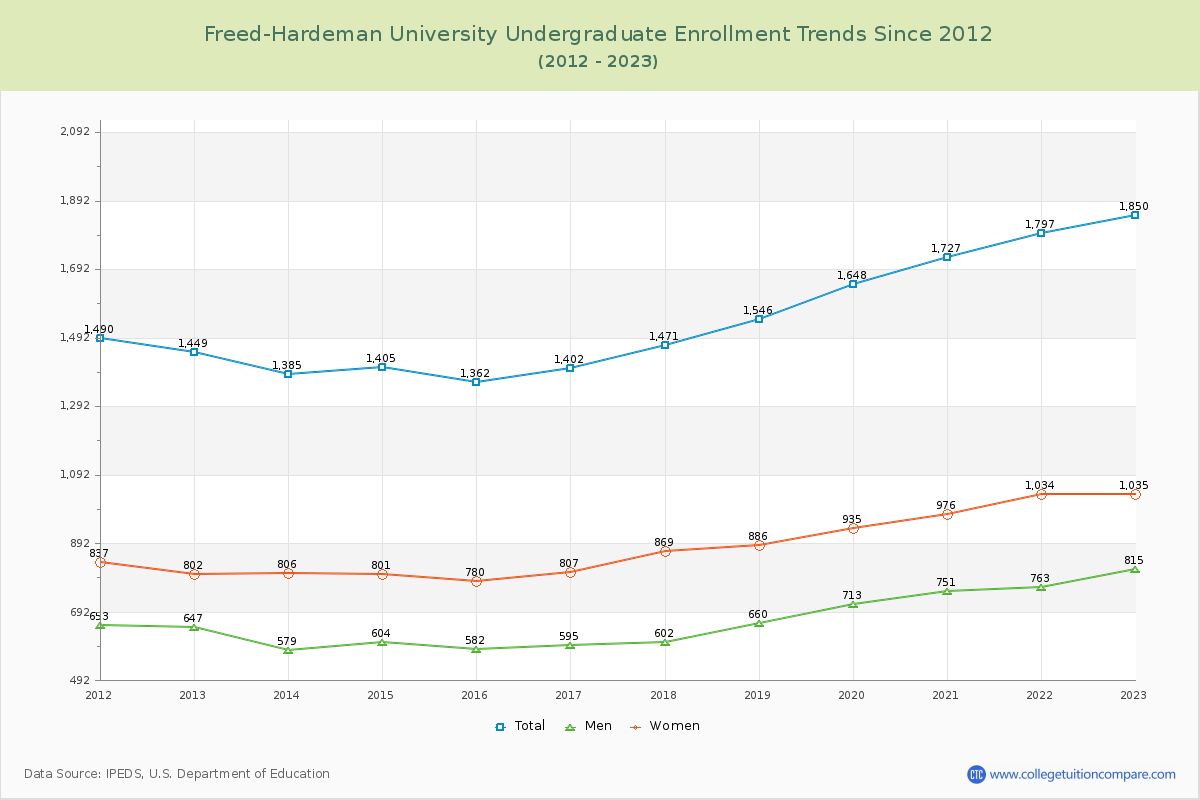
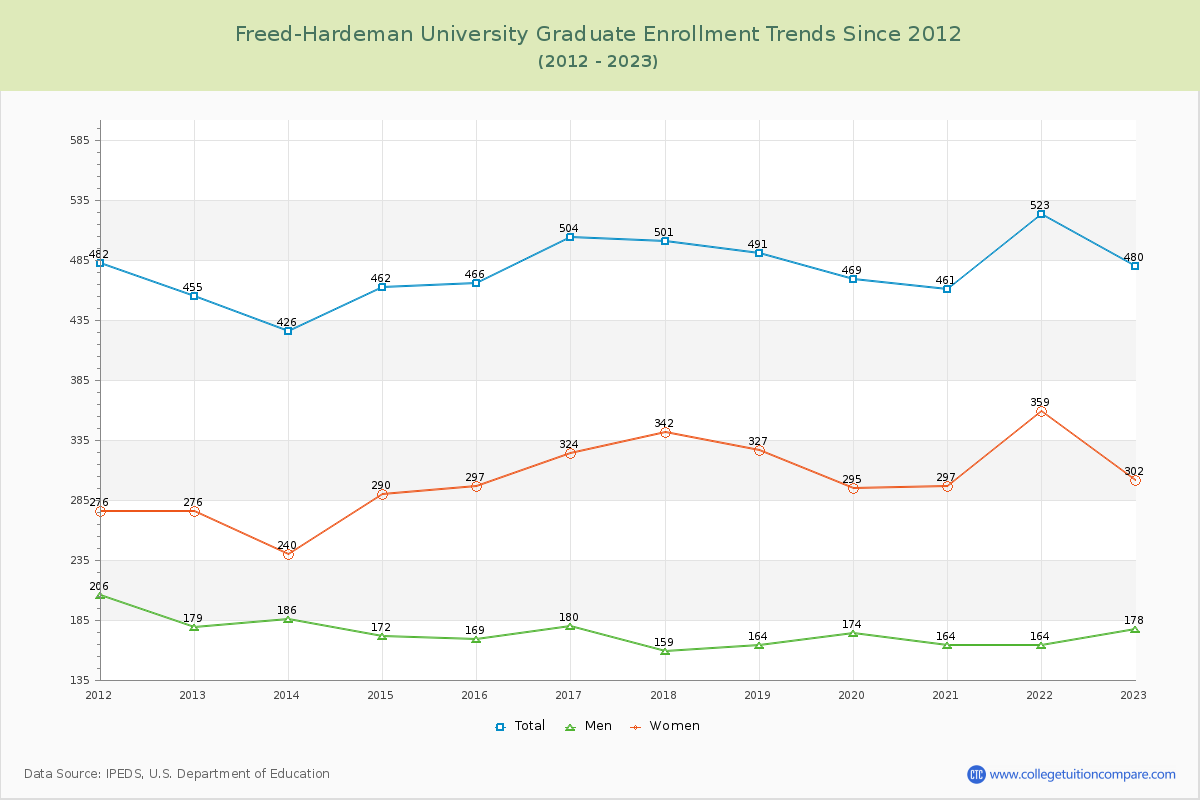
79.40% of total students is undergraduate students and 20.60% students is graduate students. The number of undergraduate students has increased by 401 and the graduate enrollment has increased by 25 over past 10 years.
The female to male ratio is 1.35 to 1 and it means that there are more female students enrolled in Freed-Hardeman than male students.
The following table and chart illustrate the changes in student population by gender at Freed-Hardeman University since 2012.
| Year | Total | Undergraduate | Graduate | ||||
|---|---|---|---|---|---|---|---|
| Total | Men | Women | Total | Men | Women | ||
| 2012-13 | 1,904 | 1,449 | 647 | 802 | 455 | 179 | 276 |
| 2013-14 | 1,811 -93 | 1,385 -64 | 579 -68 | 806 4 | 426 -29 | 186 7 | 240 -36 |
| 2014-15 | 1,867 56 | 1,405 20 | 604 25 | 801 -5 | 462 36 | 172 -14 | 290 50 |
| 2015-16 | 1,828 -39 | 1,362 -43 | 582 -22 | 780 -21 | 466 4 | 169 -3 | 297 7 |
| 2016-17 | 1,906 78 | 1,402 40 | 595 13 | 807 27 | 504 38 | 180 11 | 324 27 |
| 2017-18 | 1,972 66 | 1,471 69 | 602 7 | 869 62 | 501 -3 | 159 -21 | 342 18 |
| 2018-19 | 2,037 65 | 1,546 75 | 660 58 | 886 17 | 491 -10 | 164 5 | 327 -15 |
| 2019-20 | 2,117 80 | 1,648 102 | 713 53 | 935 49 | 469 -22 | 174 10 | 295 -32 |
| 2020-21 | 2,188 71 | 1,727 79 | 751 38 | 976 41 | 461 -8 | 164 -10 | 297 2 |
| 2021-22 | 2,320 132 | 1,797 70 | 763 12 | 1,034 58 | 523 62 | 164 0 | 359 62 |
| 2022-23 | 2,330 10 | 1,850 53 | 815 52 | 1,035 1 | 480 -43 | 178 14 | 302 -57 |
| Average | 2,025 | 1,549 | 665 | 885 | 476 | 172 | 304 |