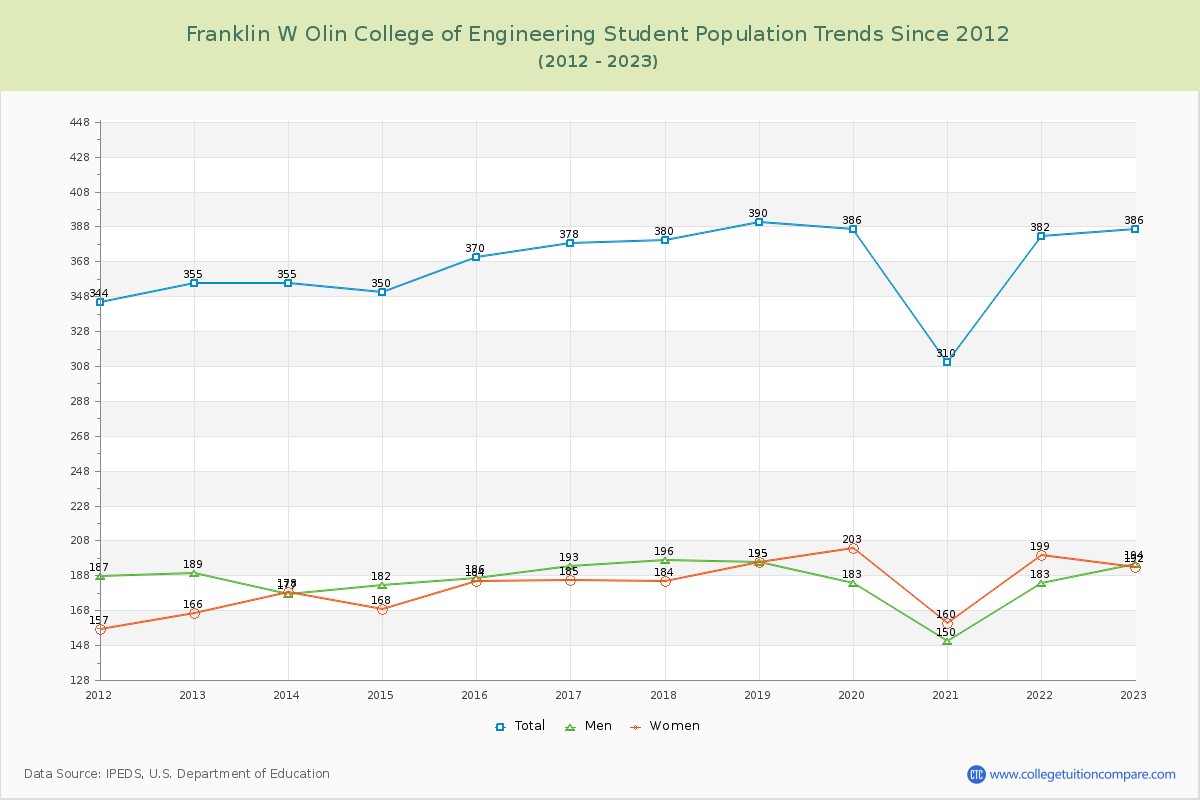
Student Population Changes
The average student population over the last 12 years is 367 where 386 students are attending the school for the academic year 2022-2023.
The female to male ratio is 0.99 to 1 and it means that there are similar numbers of female and male students enrolled in Franklin W Olin College of Engineering.
The following table and chart illustrate the changes in student population by gender at Franklin W Olin College of Engineering since 2012.
| Year | Total | Men | Women |
|---|---|---|---|
| 2012-13 | 355 | 189 | 166 |
| 2013-14 | 355 0 | 177 -12 | 178 12 |
| 2014-15 | 350 -5 | 182 5 | 168 -10 |
| 2015-16 | 370 20 | 186 4 | 184 16 |
| 2016-17 | 378 8 | 193 7 | 185 1 |
| 2017-18 | 380 2 | 196 3 | 184 -1 |
| 2018-19 | 390 10 | 195 -1 | 195 11 |
| 2019-20 | 386 -4 | 183 -12 | 203 8 |
| 2020-21 | 310 -76 | 150 -33 | 160 -43 |
| 2021-22 | 382 72 | 183 33 | 199 39 |
| 2022-23 | 386 4 | 194 11 | 192 -7 |
| Average | 367 | 184 | 183 |