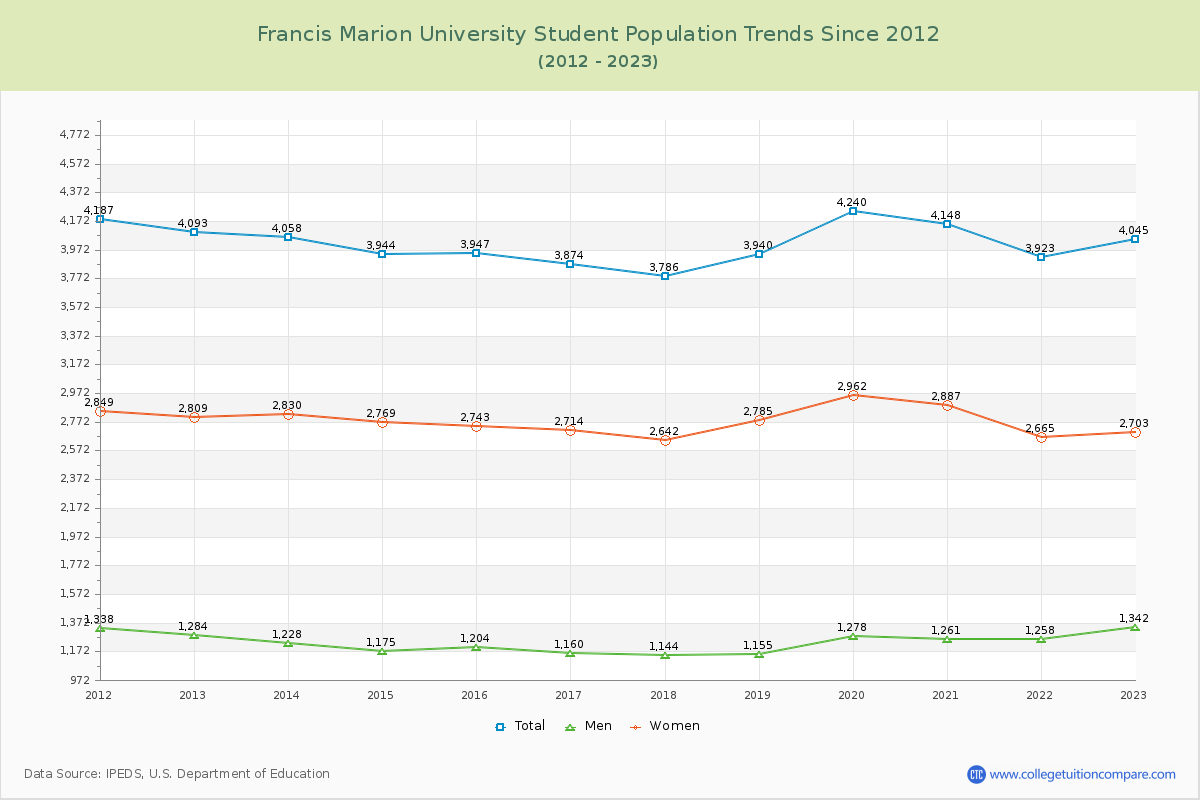
Student Population Changes
The average student population over the last 12 years is 4,000 where 4,045 students are attending the school for the academic year 2022-2023.
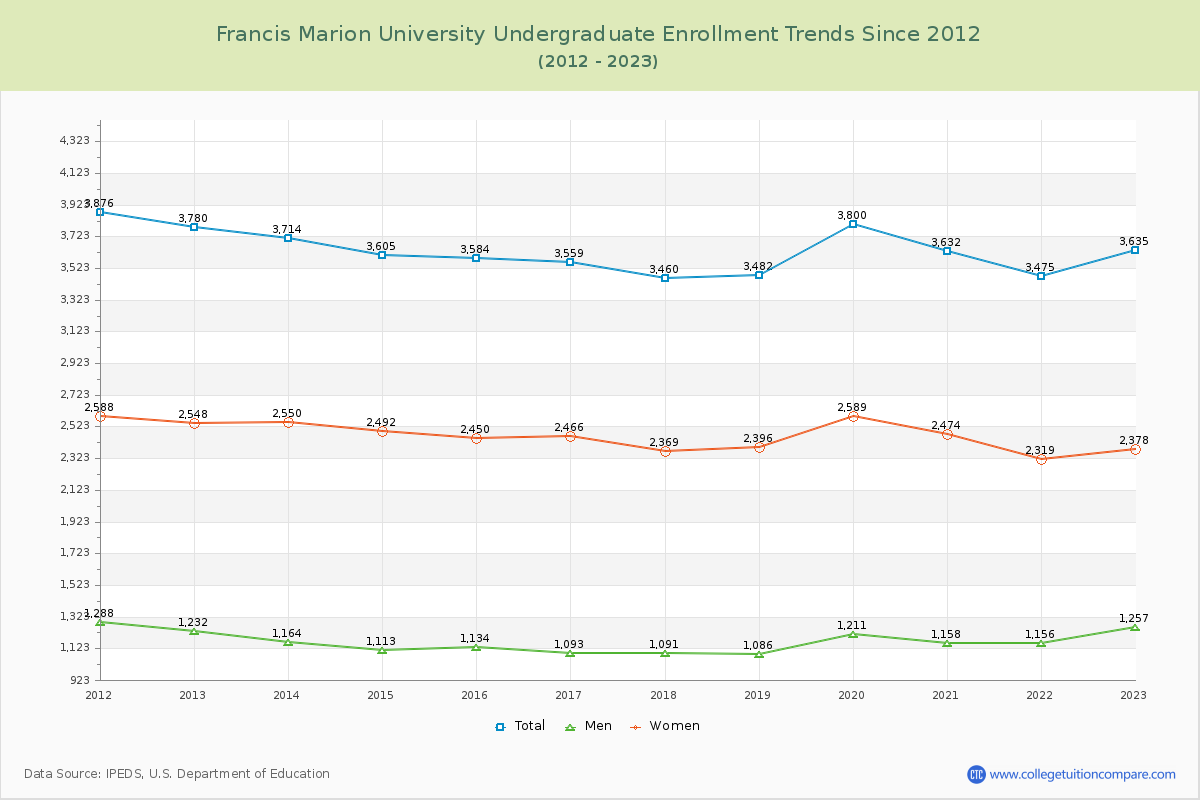
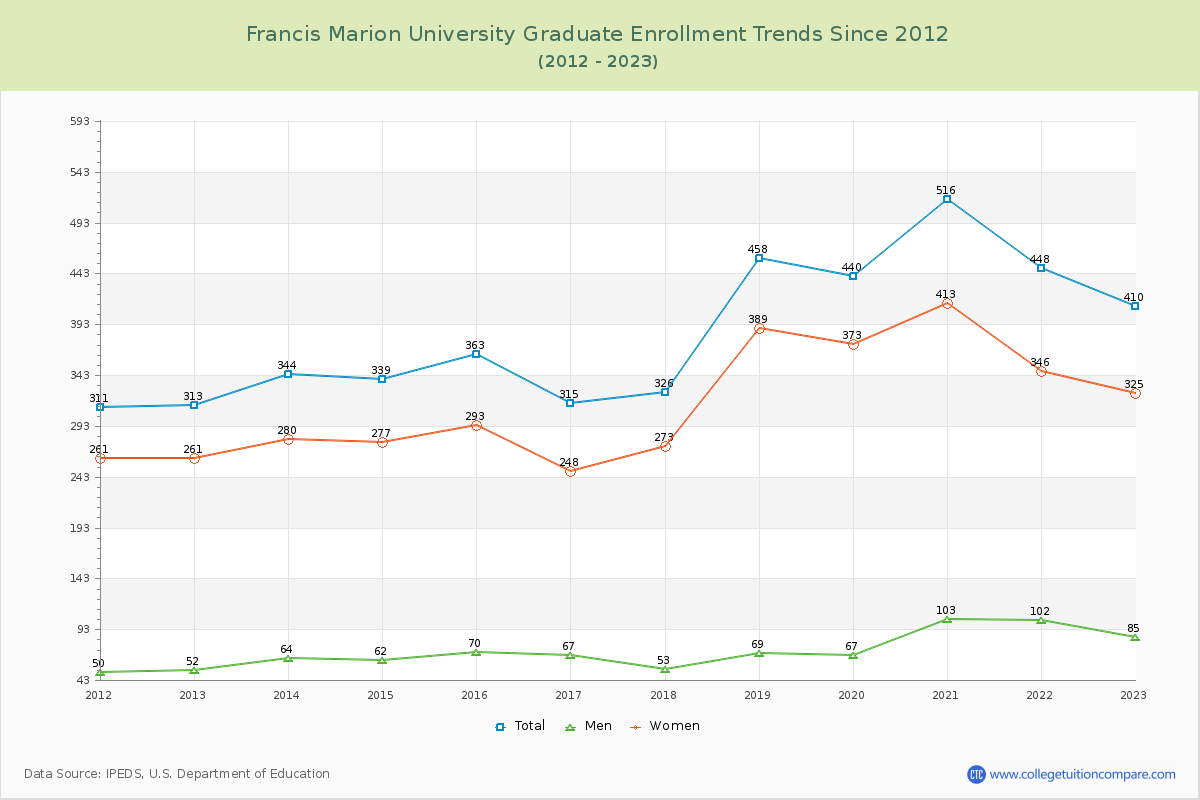
89.86% of total students is undergraduate students and 10.14% students is graduate students. The number of undergraduate students has decreased by 145 and the graduate enrollment has increased by 97 over past 10 years.
The female to male ratio is 2.01 to 1 and it means that there are far more female students enrolled in Francis Marion than male students.
The following table and chart illustrate the changes in student population by gender at Francis Marion University since 2012.
| Year | Total | Undergraduate | Graduate | ||||
|---|---|---|---|---|---|---|---|
| Total | Men | Women | Total | Men | Women | ||
| 2012-13 | 4,093 | 3,780 | 1,232 | 2,548 | 313 | 52 | 261 |
| 2013-14 | 4,058 -35 | 3,714 -66 | 1,164 -68 | 2,550 2 | 344 31 | 64 12 | 280 19 |
| 2014-15 | 3,944 -114 | 3,605 -109 | 1,113 -51 | 2,492 -58 | 339 -5 | 62 -2 | 277 -3 |
| 2015-16 | 3,947 3 | 3,584 -21 | 1,134 21 | 2,450 -42 | 363 24 | 70 8 | 293 16 |
| 2016-17 | 3,874 -73 | 3,559 -25 | 1,093 -41 | 2,466 16 | 315 -48 | 67 -3 | 248 -45 |
| 2017-18 | 3,786 -88 | 3,460 -99 | 1,091 -2 | 2,369 -97 | 326 11 | 53 -14 | 273 25 |
| 2018-19 | 3,940 154 | 3,482 22 | 1,086 -5 | 2,396 27 | 458 132 | 69 16 | 389 116 |
| 2019-20 | 4,240 300 | 3,800 318 | 1,211 125 | 2,589 193 | 440 -18 | 67 -2 | 373 -16 |
| 2020-21 | 4,148 -92 | 3,632 -168 | 1,158 -53 | 2,474 -115 | 516 76 | 103 36 | 413 40 |
| 2021-22 | 3,923 -225 | 3,475 -157 | 1,156 -2 | 2,319 -155 | 448 -68 | 102 -1 | 346 -67 |
| 2022-23 | 4,045 122 | 3,635 160 | 1,257 101 | 2,378 59 | 410 -38 | 85 -17 | 325 -21 |
| Average | 4,000 | 3,611 | 1,154 | 2,457 | 388 | 72 | 316 |