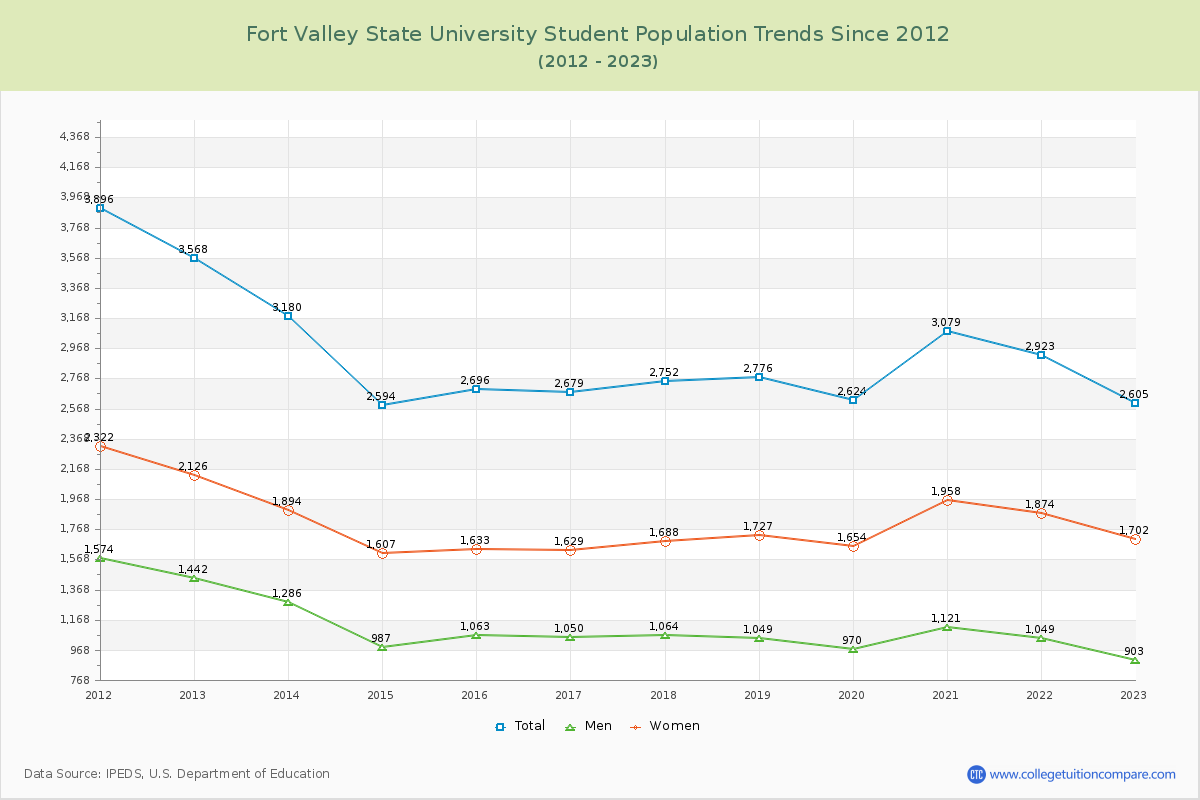
Student Population Changes
The average student population over the last 12 years is 2,861 where 2,605 students are attending the school for the academic year 2022-2023.
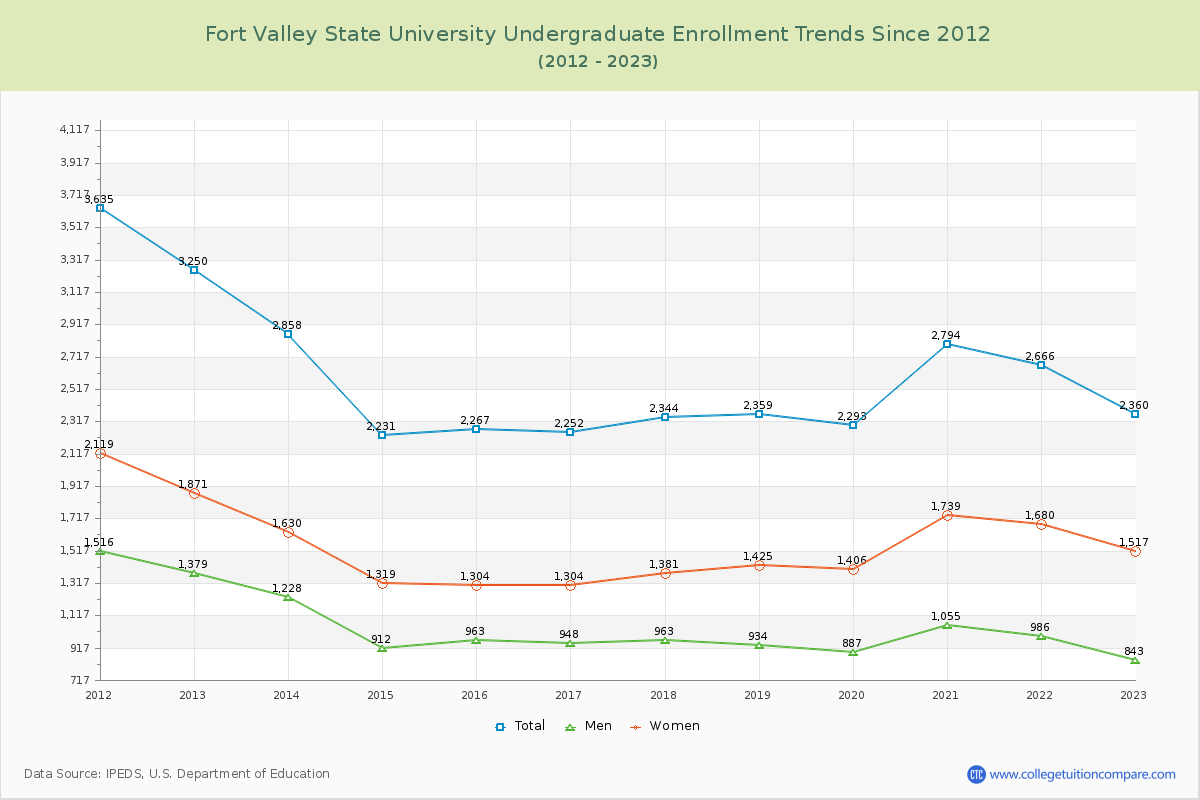
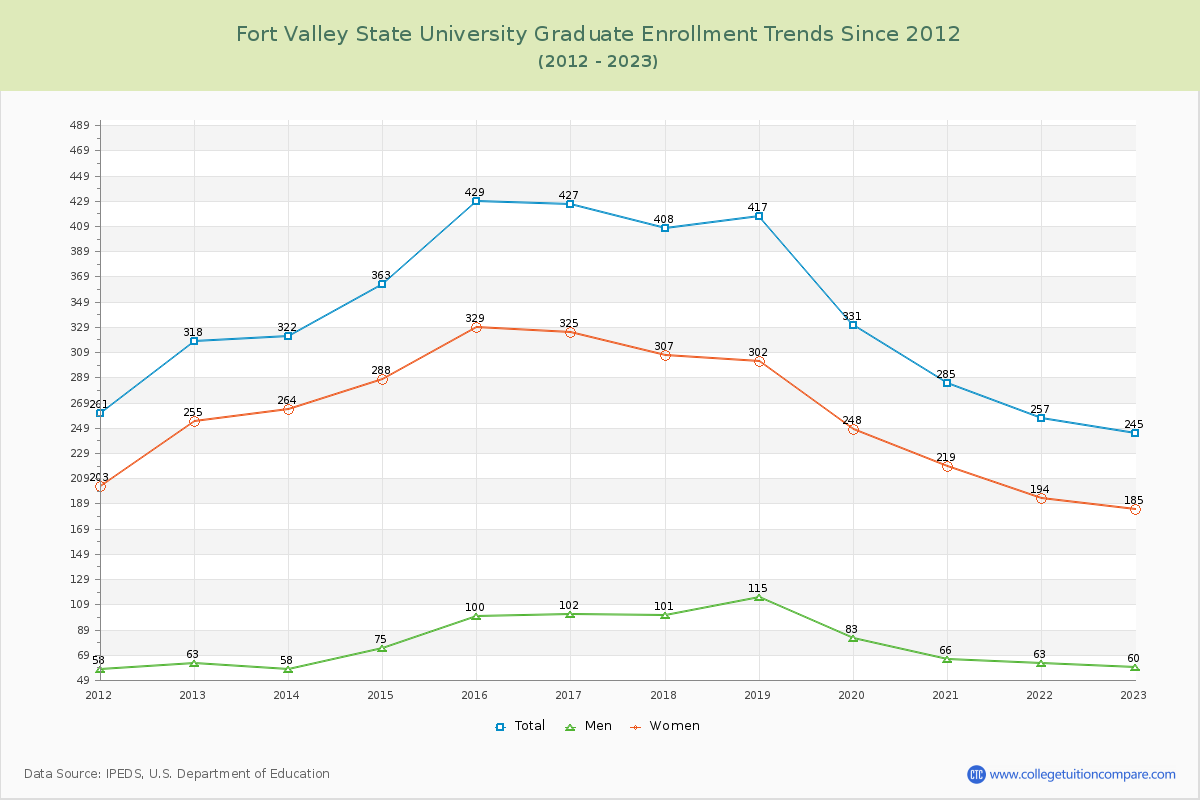
90.60% of total students is undergraduate students and 9.40% students is graduate students. The number of undergraduate students has decreased by 890 and the graduate enrollment has decreased by 73 over past 10 years.
The female to male ratio is 1.88 to 1 and it means that there are more female students enrolled in Fort Valley State than male students.
The following table and chart illustrate the changes in student population by gender at Fort Valley State University since 2012.
| Year | Total | Undergraduate | Graduate | ||||
|---|---|---|---|---|---|---|---|
| Total | Men | Women | Total | Men | Women | ||
| 2012-13 | 3,568 | 3,250 | 1,379 | 1,871 | 318 | 63 | 255 |
| 2013-14 | 3,180 -388 | 2,858 -392 | 1,228 -151 | 1,630 -241 | 322 4 | 58 -5 | 264 9 |
| 2014-15 | 2,594 -586 | 2,231 -627 | 912 -316 | 1,319 -311 | 363 41 | 75 17 | 288 24 |
| 2015-16 | 2,696 102 | 2,267 36 | 963 51 | 1,304 -15 | 429 66 | 100 25 | 329 41 |
| 2016-17 | 2,679 -17 | 2,252 -15 | 948 -15 | 1,304 0 | 427 -2 | 102 2 | 325 -4 |
| 2017-18 | 2,752 73 | 2,344 92 | 963 15 | 1,381 77 | 408 -19 | 101 -1 | 307 -18 |
| 2018-19 | 2,776 24 | 2,359 15 | 934 -29 | 1,425 44 | 417 9 | 115 14 | 302 -5 |
| 2019-20 | 2,624 -152 | 2,293 -66 | 887 -47 | 1,406 -19 | 331 -86 | 83 -32 | 248 -54 |
| 2020-21 | 3,079 455 | 2,794 501 | 1,055 168 | 1,739 333 | 285 -46 | 66 -17 | 219 -29 |
| 2021-22 | 2,923 -156 | 2,666 -128 | 986 -69 | 1,680 -59 | 257 -28 | 63 -3 | 194 -25 |
| 2022-23 | 2,605 -318 | 2,360 -306 | 843 -143 | 1,517 -163 | 245 -12 | 60 -3 | 185 -9 |
| Average | 2,861 | 2,516 | 1,009 | 1,507 | 346 | 81 | 265 |