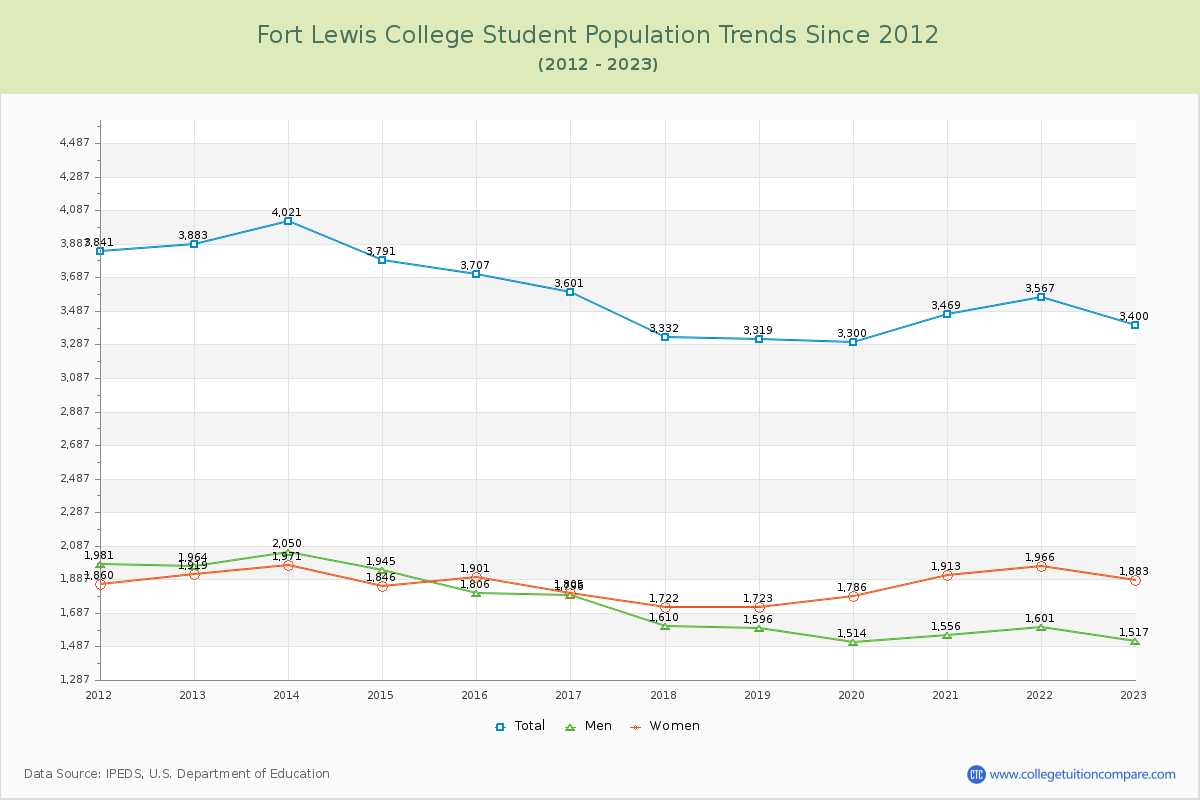
Student Population Changes
The average student population over the last 12 years is 3,581 where 3,400 students are attending the school for the academic year 2022-2023.
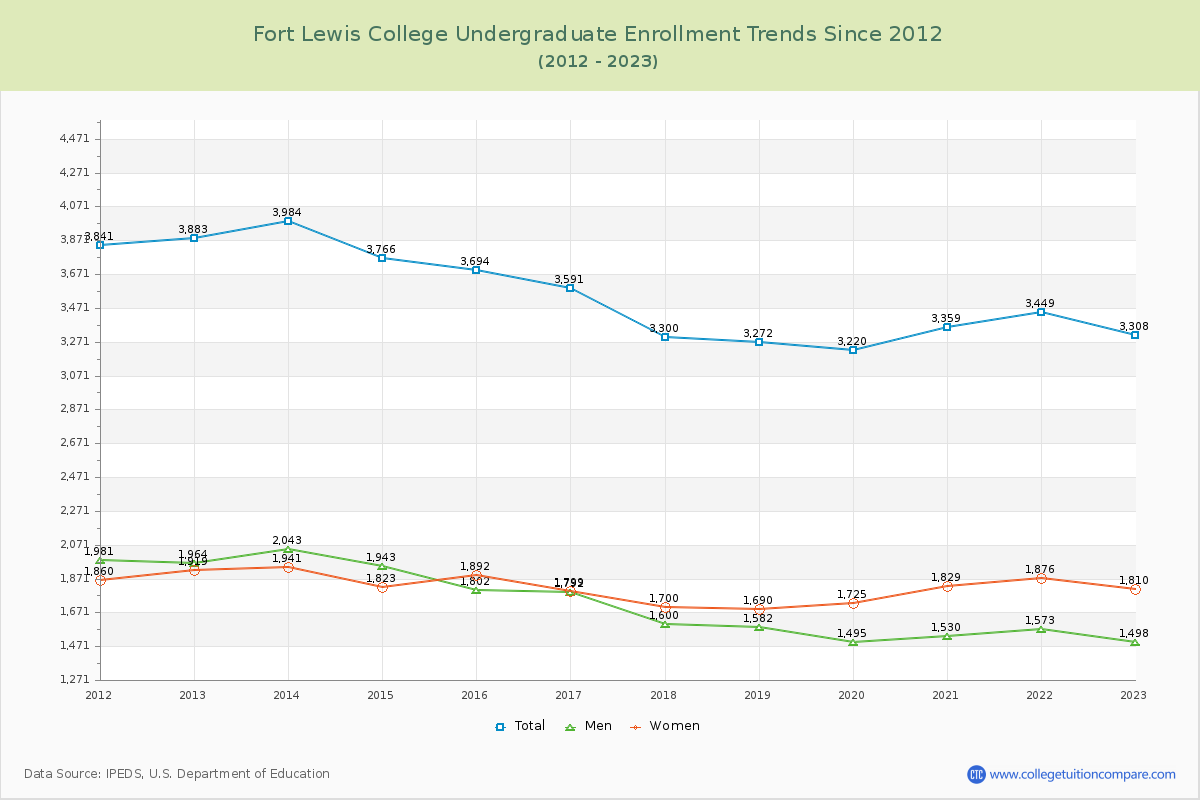
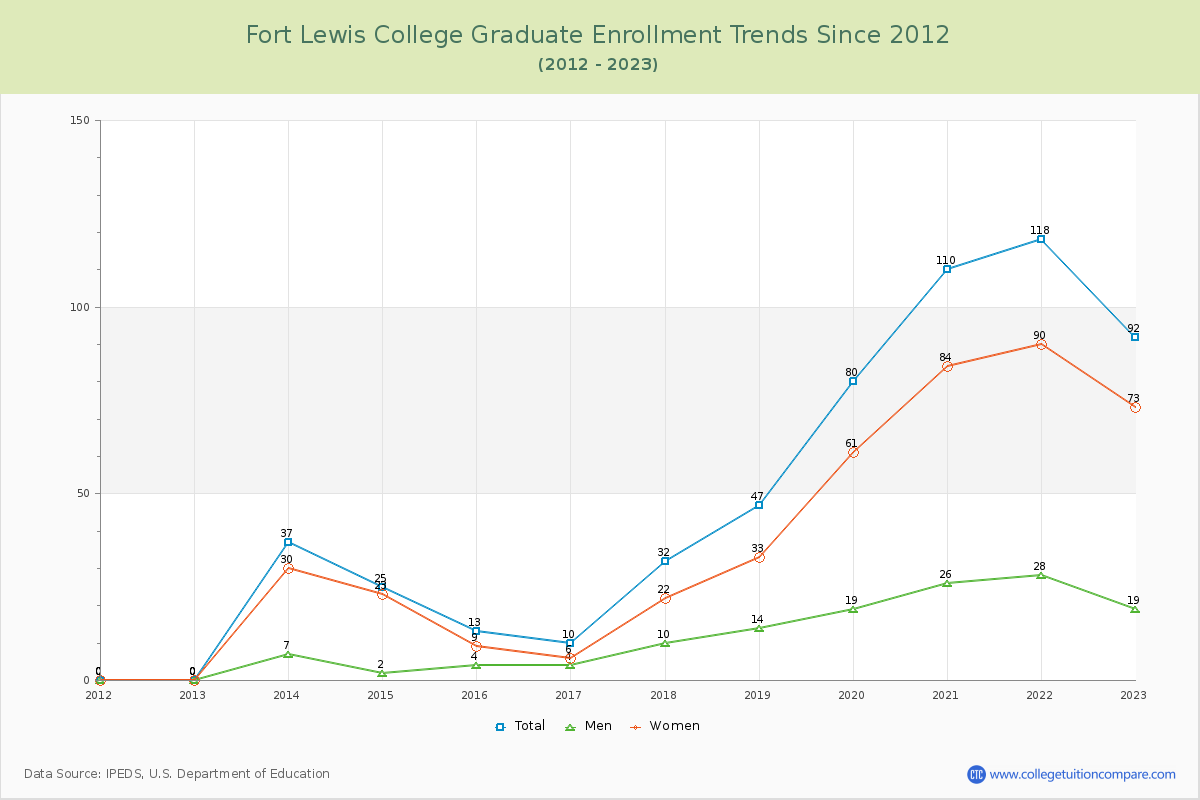
97.29% of total students is undergraduate students and 2.71% students is graduate students. The number of undergraduate students has decreased by 575 and the graduate enrollment has increased by 92 over past 10 years.
The female to male ratio is 1.24 to 1 and it means that there are slightly more female students enrolled in FLC than male students.
The following table and chart illustrate the changes in student population by gender at Fort Lewis College since 2012.
| Year | Total | Undergraduate | Graduate | ||||
|---|---|---|---|---|---|---|---|
| Total | Men | Women | Total | Men | Women | ||
| 2012-13 | 3,883 | 3,883 | 1,964 | 1,919 | 0 | 0 | 0 |
| 2013-14 | 4,021 138 | 3,984 101 | 2,043 79 | 1,941 22 | 37 37 | 7 7 | 30 30 |
| 2014-15 | 3,791 -230 | 3,766 -218 | 1,943 -100 | 1,823 -118 | 25 -12 | 2 -5 | 23 -7 |
| 2015-16 | 3,707 -84 | 3,694 -72 | 1,802 -141 | 1,892 69 | 13 -12 | 4 2 | 9 -14 |
| 2016-17 | 3,601 -106 | 3,591 -103 | 1,792 -10 | 1,799 -93 | 10 -3 | 4 0 | 6 -3 |
| 2017-18 | 3,332 -269 | 3,300 -291 | 1,600 -192 | 1,700 -99 | 32 22 | 10 6 | 22 16 |
| 2018-19 | 3,319 -13 | 3,272 -28 | 1,582 -18 | 1,690 -10 | 47 15 | 14 4 | 33 11 |
| 2019-20 | 3,300 -19 | 3,220 -52 | 1,495 -87 | 1,725 35 | 80 33 | 19 5 | 61 28 |
| 2020-21 | 3,469 169 | 3,359 139 | 1,530 35 | 1,829 104 | 110 30 | 26 7 | 84 23 |
| 2021-22 | 3,567 98 | 3,449 90 | 1,573 43 | 1,876 47 | 118 8 | 28 2 | 90 6 |
| 2022-23 | 3,400 -167 | 3,308 -141 | 1,498 -75 | 1,810 -66 | 92 -26 | 19 -9 | 73 -17 |
| Average | 3,581 | 3,530 | 1,711 | 1,819 | 51 | 12 | 39 |