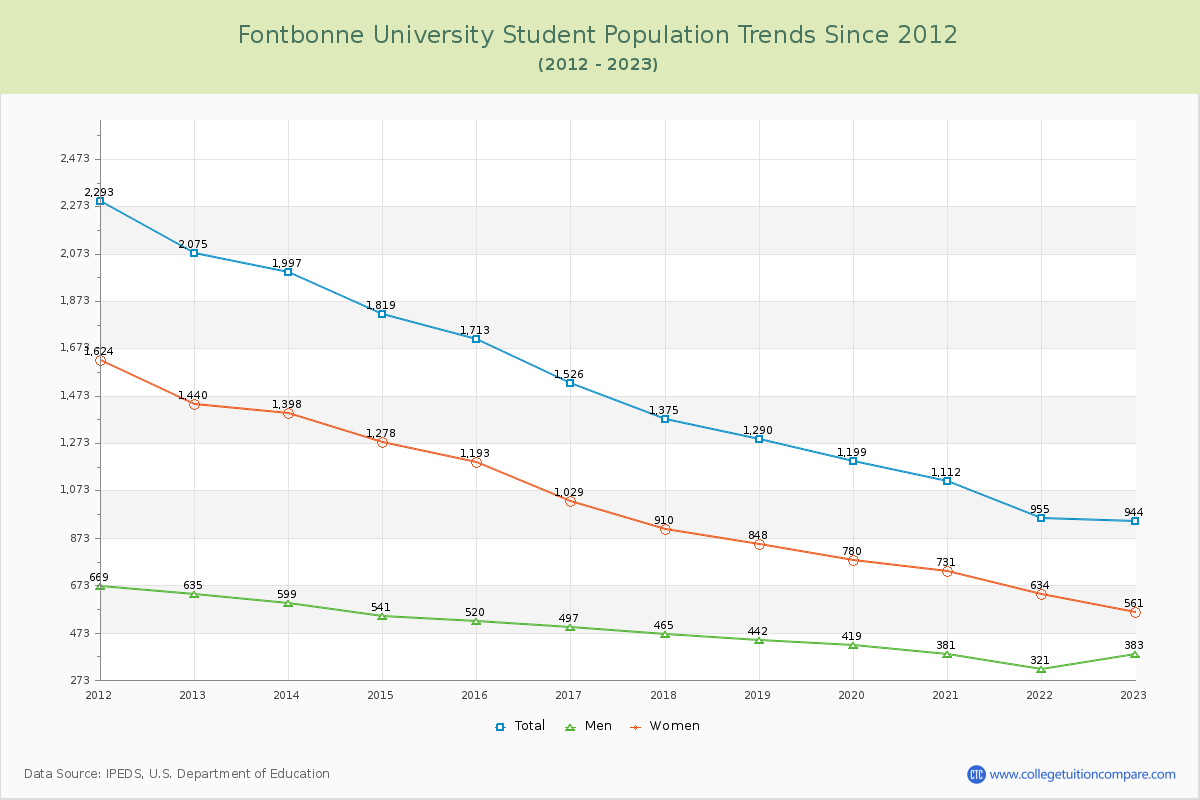
Student Population Changes
The average student population over the last 12 years is 1,455 where 944 students are attending the school for the academic year 2022-2023.
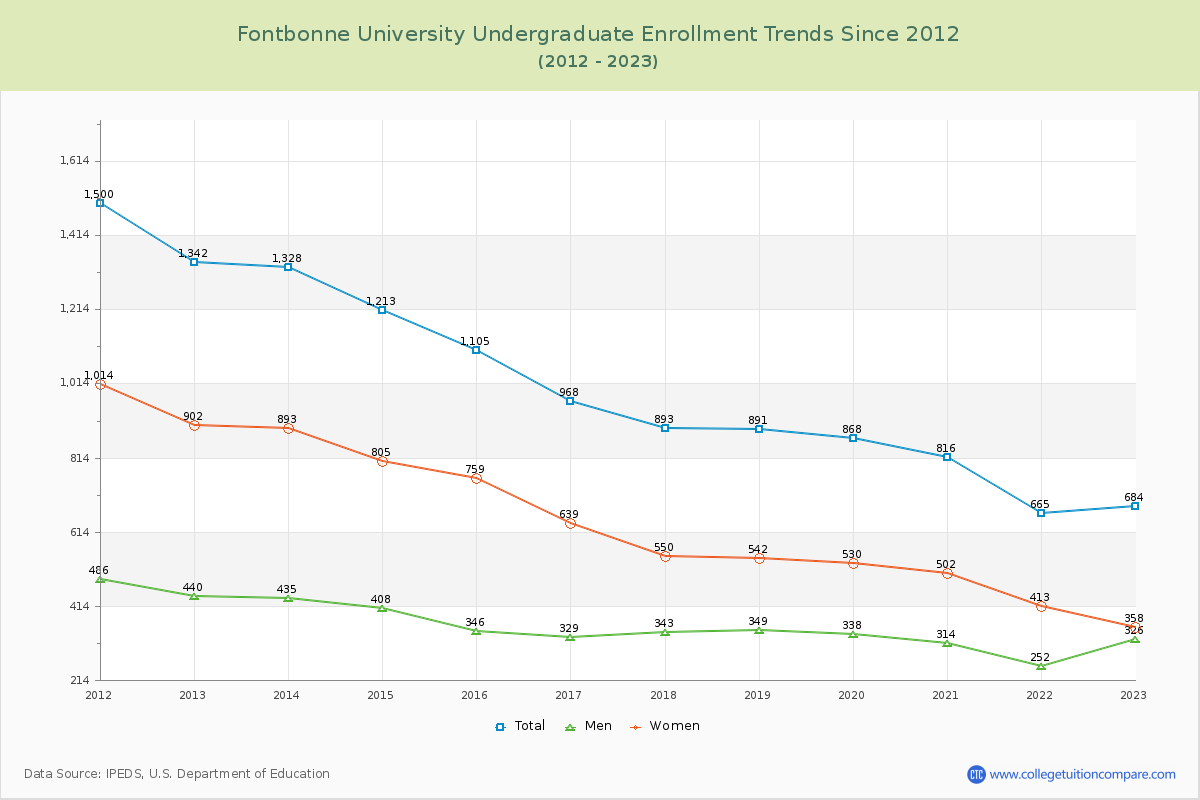
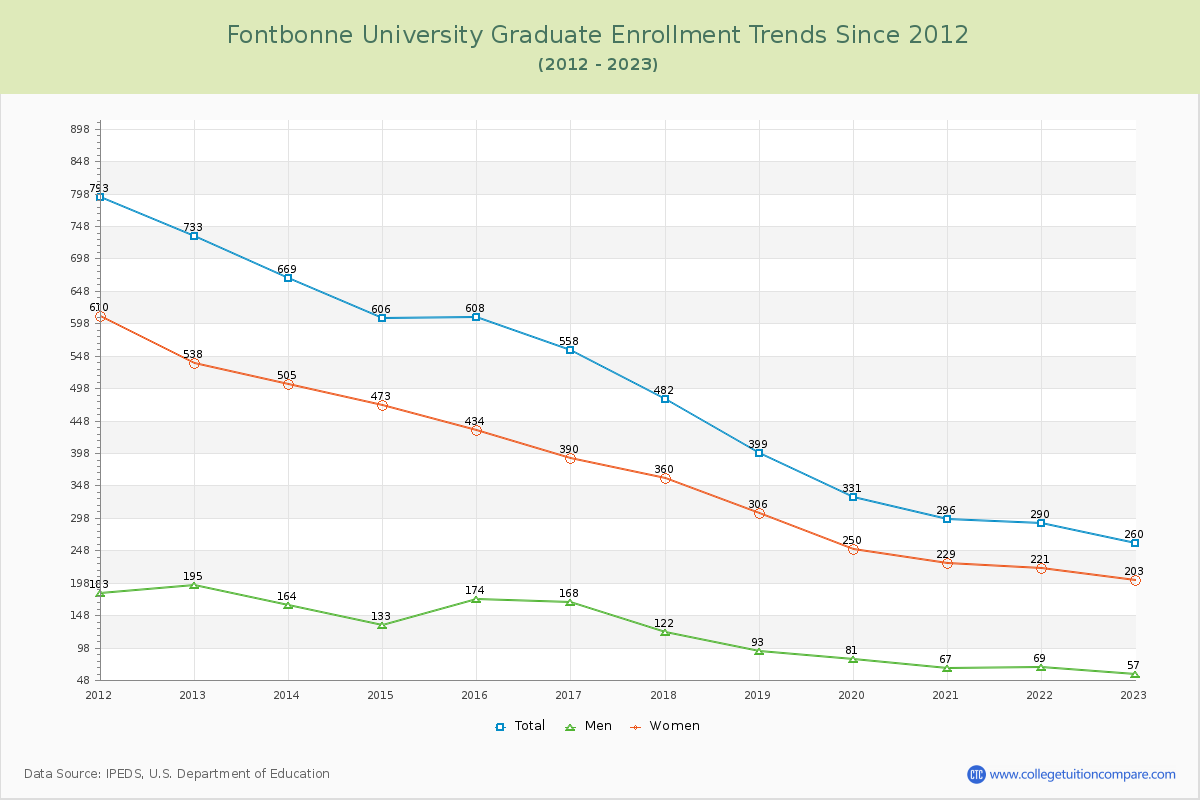
72.46% of total students is undergraduate students and 27.54% students is graduate students. The number of undergraduate students has decreased by 658 and the graduate enrollment has decreased by 473 over past 10 years.
The female to male ratio is 1.46 to 1 and it means that there are more female students enrolled in Fontbonne than male students.
The following table and chart illustrate the changes in student population by gender at Fontbonne University since 2012.
| Year | Total | Undergraduate | Graduate | ||||
|---|---|---|---|---|---|---|---|
| Total | Men | Women | Total | Men | Women | ||
| 2012-13 | 2,075 | 1,342 | 440 | 902 | 733 | 195 | 538 |
| 2013-14 | 1,997 -78 | 1,328 -14 | 435 -5 | 893 -9 | 669 -64 | 164 -31 | 505 -33 |
| 2014-15 | 1,819 -178 | 1,213 -115 | 408 -27 | 805 -88 | 606 -63 | 133 -31 | 473 -32 |
| 2015-16 | 1,713 -106 | 1,105 -108 | 346 -62 | 759 -46 | 608 2 | 174 41 | 434 -39 |
| 2016-17 | 1,526 -187 | 968 -137 | 329 -17 | 639 -120 | 558 -50 | 168 -6 | 390 -44 |
| 2017-18 | 1,375 -151 | 893 -75 | 343 14 | 550 -89 | 482 -76 | 122 -46 | 360 -30 |
| 2018-19 | 1,290 -85 | 891 -2 | 349 6 | 542 -8 | 399 -83 | 93 -29 | 306 -54 |
| 2019-20 | 1,199 -91 | 868 -23 | 338 -11 | 530 -12 | 331 -68 | 81 -12 | 250 -56 |
| 2020-21 | 1,112 -87 | 816 -52 | 314 -24 | 502 -28 | 296 -35 | 67 -14 | 229 -21 |
| 2021-22 | 955 -157 | 665 -151 | 252 -62 | 413 -89 | 290 -6 | 69 2 | 221 -8 |
| 2022-23 | 944 -11 | 684 19 | 326 74 | 358 -55 | 260 -30 | 57 -12 | 203 -18 |
| Average | 1,455 | 979 | 353 | 627 | 476 | 120 | 355 |