Enrollment Trends at Florence-Darlington Technical

-2,485

Total Enrollment

-948

Men

-1,537

Women

The student population at Florence-Darlington Technical College is 3,522 (all undergraduate). The number of students has decreased by 2,485 over the past decade.

The female to male ratio is 1.90 to 1 which means that female students enrolled more than male students.

1,423 students enrolled in online degree program exclusively and the number of online students has decreased by -42.57% since 2015.

Student Population Changes

The average student population over the last 11 years is 4,135 where 3,522 students are attending the school for the academic year 2024-2025.

The female to male ratio is 1.90 to 1 and it means that there are more female students enrolled in Florence-Darlington Technical than male students.

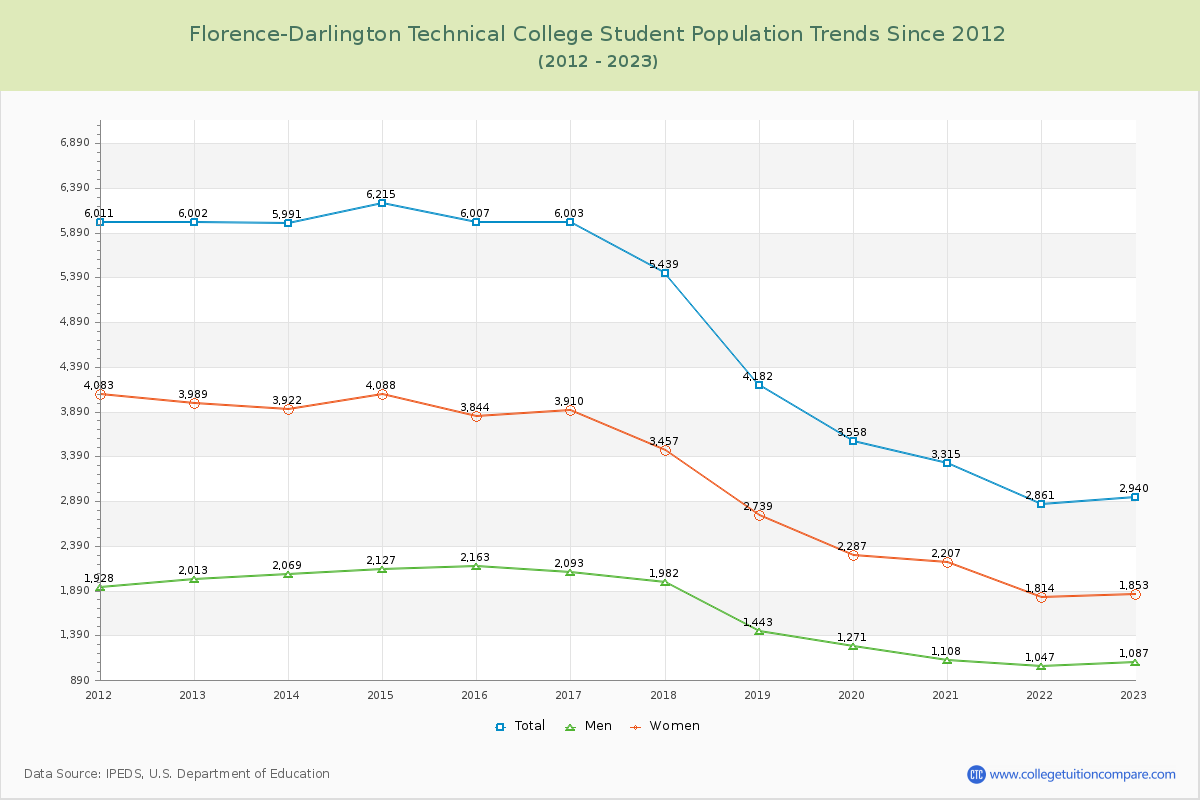
The following table and chart illustrate the changes in student population by gender at Florence-Darlington Technical College since 2015.

YearTotalMenWomen
2015-166,0072,1633,844
2016-176,003
-4
2,093
-70
3,910
66
2017-185,439
-564
1,982
-111
3,457
-453
2018-194,182
-1,257
1,443
-539
2,739
-718
2019-203,558
-624
1,271
-172
2,287
-452
2020-213,315
-243
1,108
-163
2,207
-80
2021-222,861
-454
1,047
-61
1,814
-393
2022-232,940
79
1,087
40
1,853
39
2023-243,521
581
1,254
167
2,267
414
2024-253,522
1
1,215
-39
2,307
40
Average4,1351,4662,669
Florence-Darlington Technical College Enrollment Trends Chart

Enrollment by Race/Ethnicity Changes

The percentage of white students is 39.44% and the percentage of black students is 48.78% at Florence-Darlington Technical College. 0.91% of enrolled students is Asian. Hispanic students comprise 0.62% of the student body.

Over the past 10 years, the racial composition has shifted. The percentage of white students decreased from 43.63% to 39.44%. Asian enrollment grew from 0.78% to 0.91%. Black student enrollment increased from 46.16% to 48.78%. Hispanic student representation contracted from 2.01% to 0.62%.

The overall racial diversity, measured by the Census Bureau Diversity Index, is 0.6057 which indicates that moderately diverse. This increased from 0.5959 a decade ago, suggesting that racial diversity has improved.

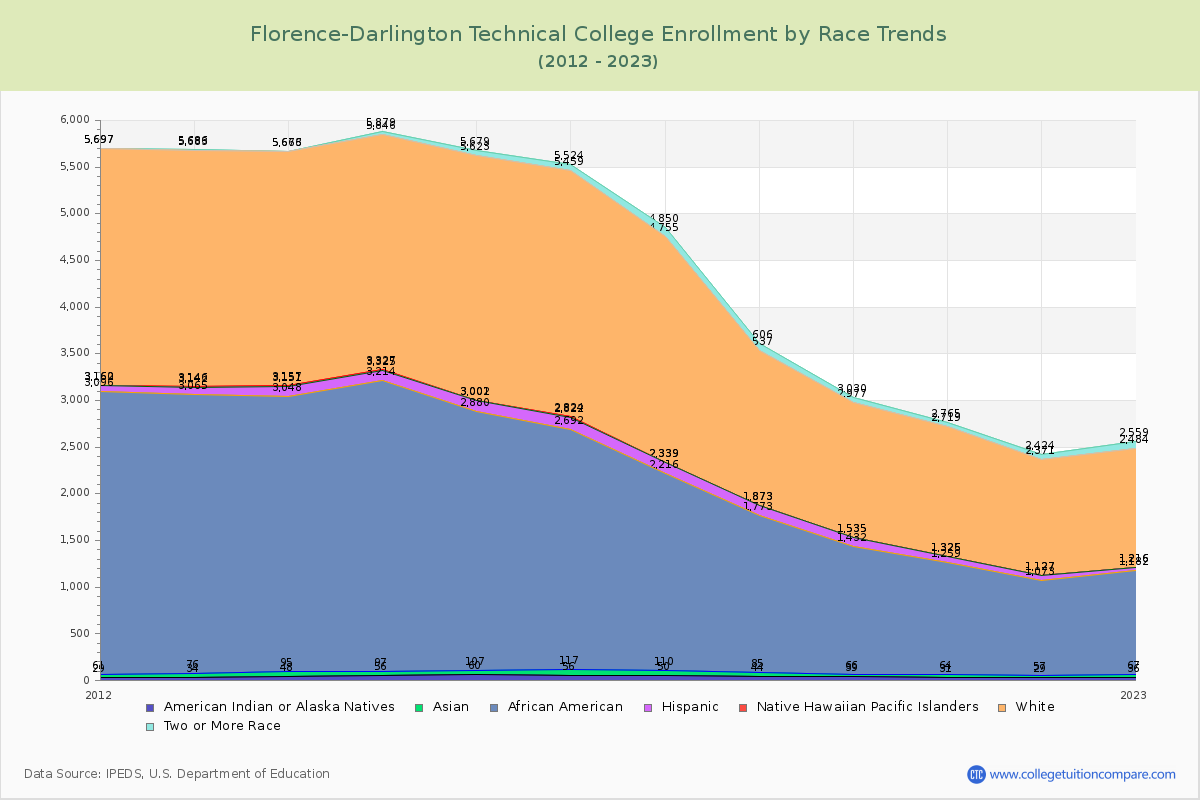
The following table and chart illustrate the student population trends by race/ethnicity at Florence-Darlington Technical College over the past 11 years (2015-2025).

YearAmerican Indian or Native AmericanAsianBlackHispanicNative Hawaiian or Other Pacific IslanderWhiteTwo or More Races
2015-1660472,77312112,62156
2016-1756612,57513022,63565
2017-1850602,10612302,41695
2018-1944411,68810001,66469
2019-2039271,36610301,44253
2020-2131331,1956611,39346
2021-2229281,0165401,24453
2022-2336311,1153401,26875
2023-2443361,5792811,42592
2024-2541321,7182211,38986
Average43401,7137811,75069
Florence-Darlington Technical College Enrollment by Race Trends Chart

Distance Learning (Online Courses) Enrollment Changes

1,423 students are enrolled in online degree programs exclusively for the academic year 2024-2025, which is 40% of total students. The number of online students has decreased -42.57% since 2015. The following table and chart illustrate the changes in the online student population by enrolled type at Florence-Darlington Technical College from 2015 to 2025.

YearTotal EnrollmentOnline CompletelyEnrolled in Some Online CoursesNot Enrolled in Online Courses
2015-166,0072,4782,1851,344
2016-176,0032,8221,9831,198
2017-185,4392,5921,7161,131
2018-194,1826841,4182,080
2019-203,5585881,1701,800
2020-213,3151,4671,139709
2021-222,8619968631,002
2022-232,9409709571,013
2023-243,5211,2661,1951,060
2024-253,5221,4231,0031,096
Average4,1351,5291,3631,243

Ratings & Review

Share your experiences and thoughts about Florence-Darlington Technical College. It will be a great help to applicants and prospective students!