Enrollment Trends at Flathead Valley CC

65

Total Enrollment

116

Men

-51

Women

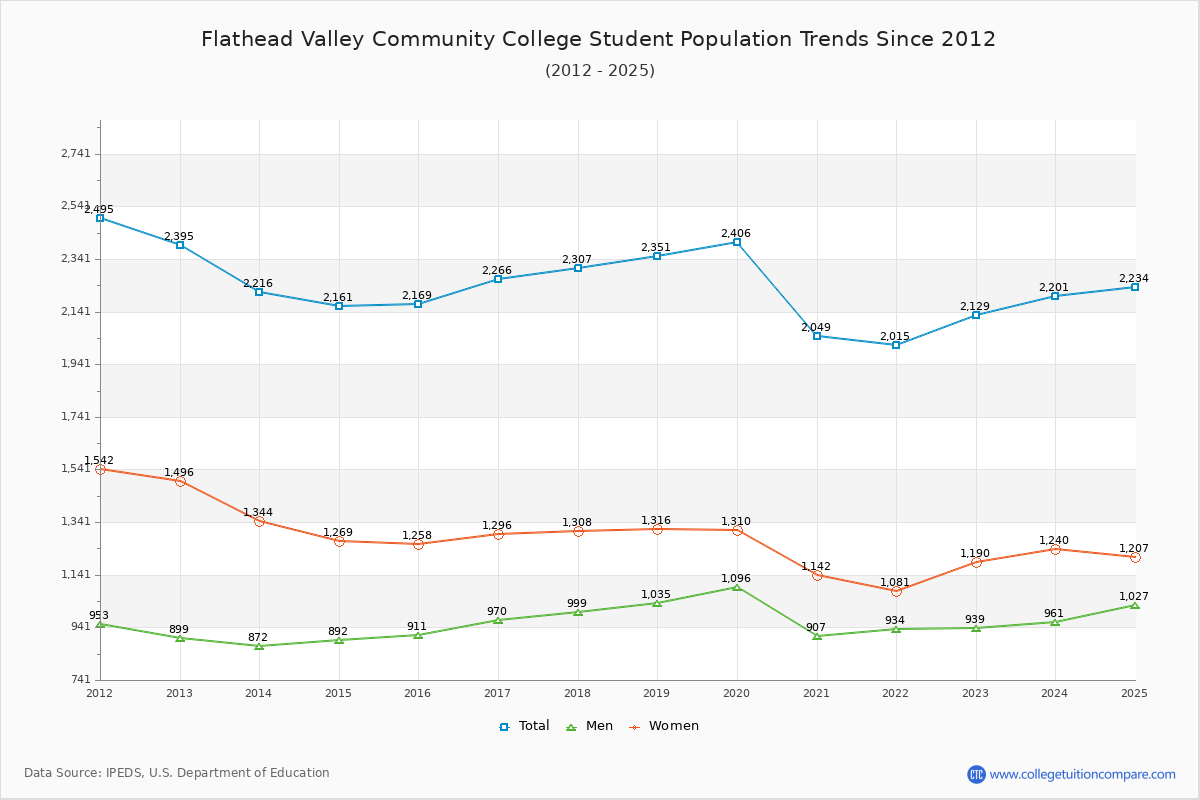
The student population at Flathead Valley Community College is 2,234 (all undergraduate). The number of students has increased by 65 over the past decade.

The female to male ratio is 1.18 to 1 which means that female students enrolled slightly more than male students.

279 students enrolled in online degree program exclusively and the number of online students has increased by 89.80% since 2015.

Student Population Changes

The average student population over the last 11 years is 2,213 where 2,234 students are attending the school for the academic year 2024-2025.

The female to male ratio is 1.18 to 1 and it means that there are slightly more female students enrolled in Flathead Valley CC than male students.

The following table and chart illustrate the changes in student population by gender at Flathead Valley Community College since 2015.

YearTotalMenWomen
2015-162,1699111,258
2016-172,266
97
970
59
1,296
38
2017-182,307
41
999
29
1,308
12
2018-192,351
44
1,035
36
1,316
8
2019-202,406
55
1,096
61
1,310
-6
2020-212,049
-357
907
-189
1,142
-168
2021-222,015
-34
934
27
1,081
-61
2022-232,129
114
939
5
1,190
109
2023-242,201
72
961
22
1,240
50
2024-252,234
33
1,027
66
1,207
-33
Average2,2139781,235
Flathead Valley Community College Enrollment Trends Chart

Enrollment by Race/Ethnicity Changes

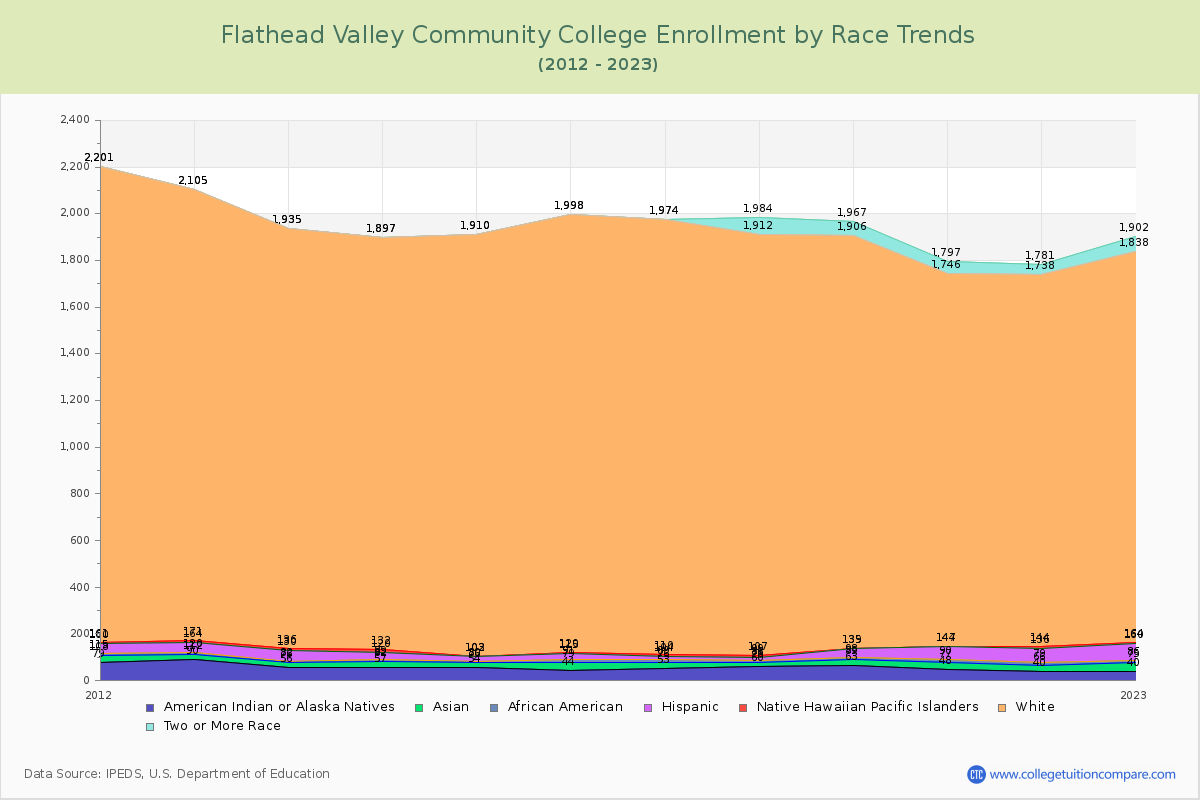
The percentage of white students is 80.08%. The percentage was 83.31% 10 years ago and Flathead Valley CC still has a high percentage of white students. 1.03% of enrolled students is Asian and 0.58% is black students. Hispanic students comprise 4.12% of the student body.

Over the past 10 years, the racial composition has shifted. The percentage of white students decreased from 83.31% to 80.08%. Asian enrollment grew from 1.01% to 1.03%. Black student enrollment increased from 0.18% to 0.58%. Hispanic student representation expanded from 1.01% to 4.12%.

The overall racial diversity, measured by the Census Bureau Diversity Index, is 0.3552 which indicates that somewhat diverse. This increased from 0.3051 a decade ago, suggesting that racial diversity has improved.

The following table and chart illustrate the student population trends by race/ethnicity at Flathead Valley Community College over the past 11 years (2015-2025).

YearAmerican Indian or Native AmericanAsianBlackHispanicNative Hawaiian or Other Pacific IslanderWhiteTwo or More Races
2015-16542242211,8070
2016-174435122451,8780
2017-185323131561,8640
2018-196016101381,80572
2019-20632693741,76761
2020-214829135431,59951
2021-224026135781,59443
2022-234035117441,67464
2023-244826139331,71986
2024-253223139231,78985
Average4826114851,75046
Flathead Valley Community College Enrollment by Race Trends Chart

Distance Learning (Online Courses) Enrollment Changes

279 students are enrolled in online degree programs exclusively for the academic year 2024-2025, which is 13% of total students. The number of online students has increased 89.80% since 2015. The following table and chart illustrate the changes in the online student population by enrolled type at Flathead Valley Community College from 2015 to 2025.

YearTotal EnrollmentOnline CompletelyEnrolled in Some Online CoursesNot Enrolled in Online Courses
2015-162,1691474171,605
2016-172,2661684321,666
2017-182,3071723441,791
2018-192,3511934321,726
2019-202,4061953361,875
2020-212,0491614441,444
2021-222,0151633611,491
2022-232,1292043551,570
2023-242,2012414071,553
2024-252,2342794891,466
Average2,2131924021,619

Ratings & Review

Share your experiences and thoughts about Flathead Valley Community College. It will be a great help to applicants and prospective students!