Enrollment Trends at Fielding Graduate

-253

Total Enrollment

-128

Men

-125

Women

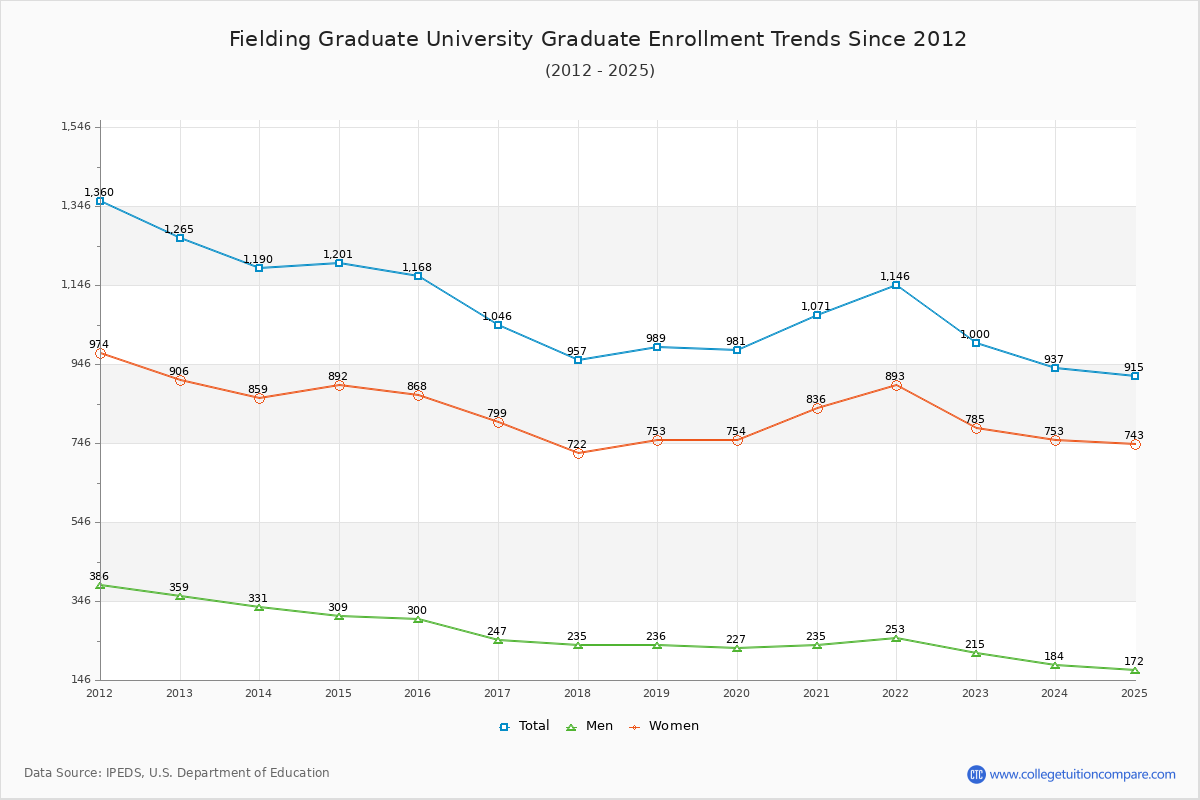
The student population at Fielding Graduate University is 915 (all graduate). The number of students has decreased by 253 over the past decade.

The female to male ratio is 4.32 to 1 which means that majority of population is on female students.

606 students enrolled in online degree program exclusively and the number of online students has increased by 426.96% since 2015.

Student Population Changes

The average student population over the last 11 years is 1,021 where 915 students are attending the school for the academic year 2024-2025.

The female to male ratio is 4.32 to 1 and it means that there are far more female students enrolled in Fielding Graduate than male students.

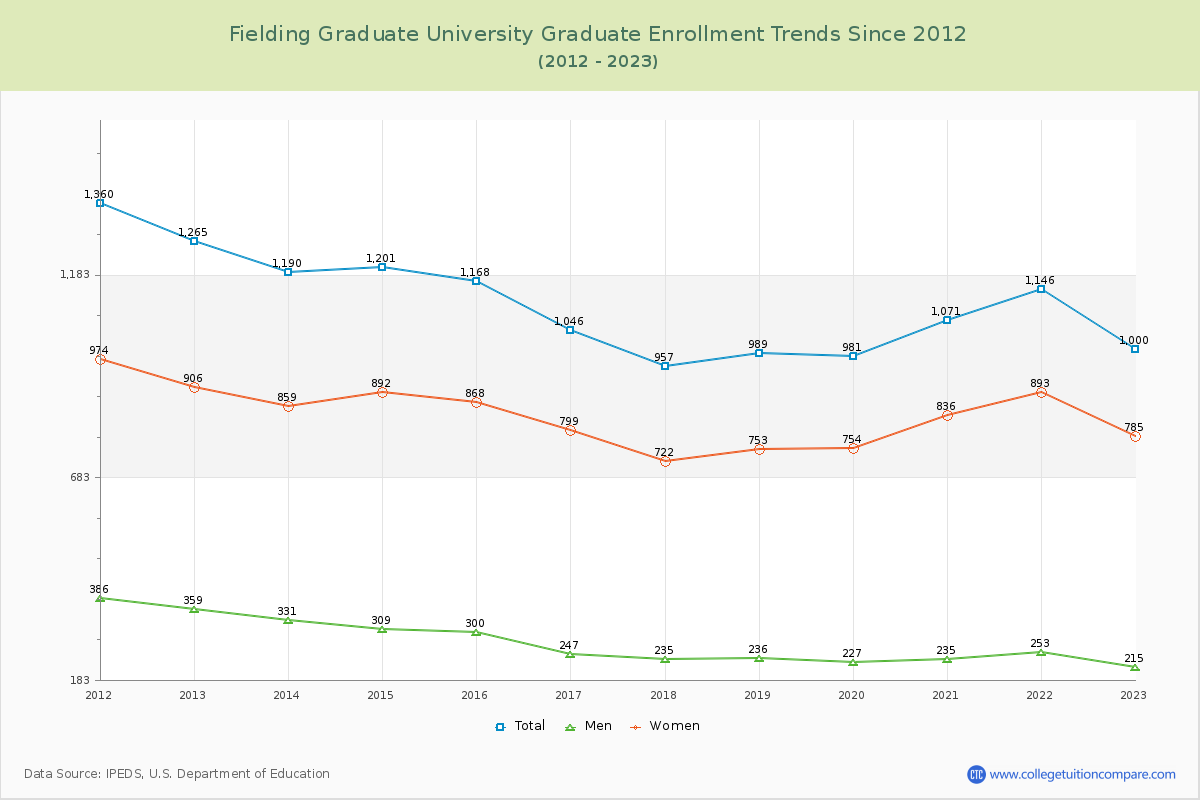
The following table and chart illustrate the changes in student population by gender at Fielding Graduate University since 2015.

YearTotalMenWomen
2015-161,168300868
2016-171,046
-122
247
-53
799
-69
2017-18957
-89
235
-12
722
-77
2018-19989
32
236
1
753
31
2019-20981
-8
227
-9
754
1
2020-211,071
90
235
8
836
82
2021-221,146
75
253
18
893
57
2022-231,000
-146
215
-38
785
-108
2023-24937
-63
184
-31
753
-32
2024-25915
-22
172
-12
743
-10
Average1,021230791
Fielding Graduate University Enrollment Trends Chart

Enrollment by Race/Ethnicity Changes

The percentage of white students is 49.62% and the percentage of black students is 18.47% at Fielding Graduate University. 4.04% of enrolled students is Asian. Hispanic students comprise 11.58% of the student body.

Over the past 10 years, the racial composition has shifted. The percentage of white students decreased from 50.00% to 49.62%. Asian enrollment grew from 3.85% to 4.04%. Black student enrollment increased from 13.96% to 18.47%. Hispanic student representation expanded from 8.99% to 11.58%.

The overall racial diversity, measured by the Census Bureau Diversity Index, is 0.6997 which indicates that moderately diverse. This decreased from 0.7192 a decade ago, suggesting that racial diversity has declined.

The following table and chart illustrate the student population trends by race/ethnicity at Fielding Graduate University over the past 11 years (2015-2025).

YearAmerican Indian or Native AmericanAsianBlackHispanicNative Hawaiian or Other Pacific IslanderWhiteTwo or More Races
2015-162145163105558444
2016-171241160107152246
2017-18734136116248260
2018-191936165109150153
2019-202636147119247558
2020-212353184131451560
2021-222552200133356266
2022-231739167129050066
2023-242038168114245663
2024-251737169106045462
Average1941166117250558
Fielding Graduate University Enrollment by Race Trends Chart

Distance Learning (Online Courses) Enrollment Changes

606 students are enrolled in online degree programs exclusively for the academic year 2024-2025, which is 66% of total students. The number of online students has increased 426.96% since 2015. The following table and chart illustrate the changes in the online student population by enrolled type at Fielding Graduate University from 2015 to 2025.

YearTotal EnrollmentOnline CompletelyEnrolled in Some Online CoursesNot Enrolled in Online Courses
2015-161,1681151,00152
2016-171,04610690238
2017-1895716075938
2018-1998911083940
2019-2098112082437
2020-211,07115088437
2021-221,14618991344
2022-231,00016979734
2023-249371348030
2024-259156063090
Average1,02118680332

Ratings & Review

Share your experiences and thoughts about Fielding Graduate University. It will be a great help to applicants and prospective students!