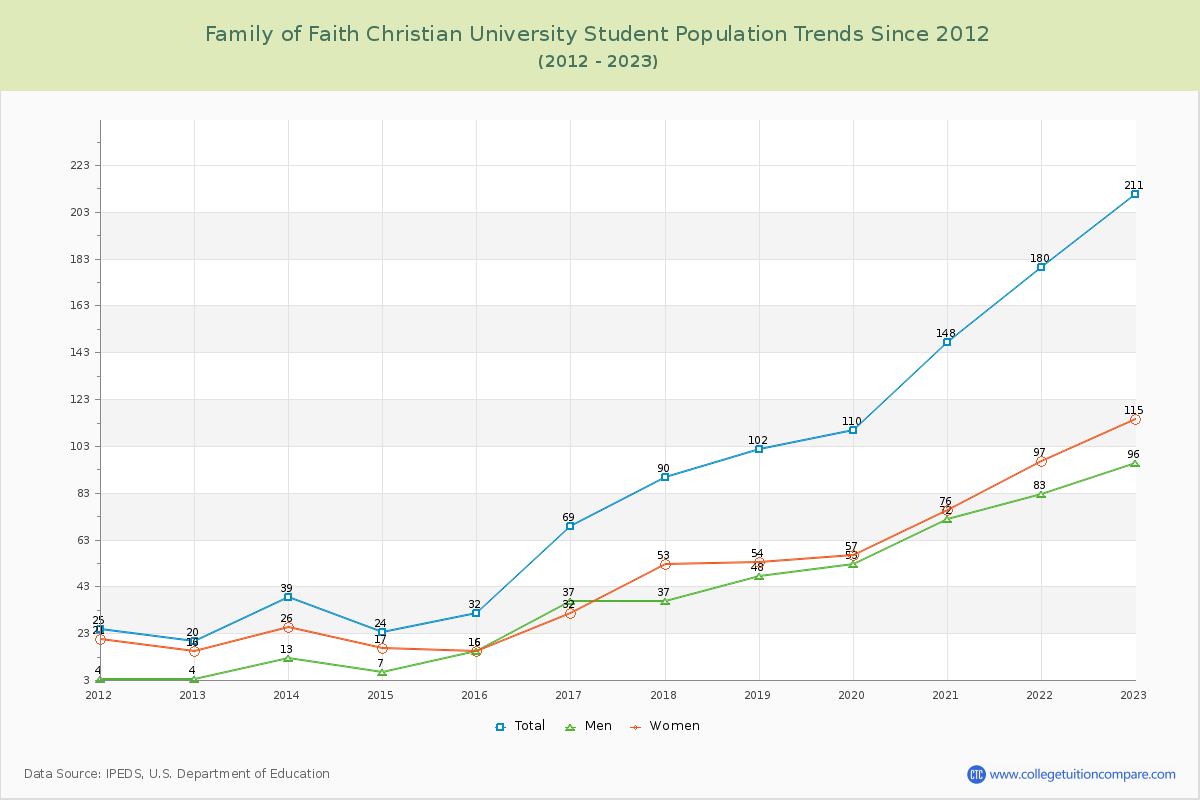
Student Population Changes
The average student population over the last 12 years is 93 where 211 students are attending the school for the academic year 2022-2023.
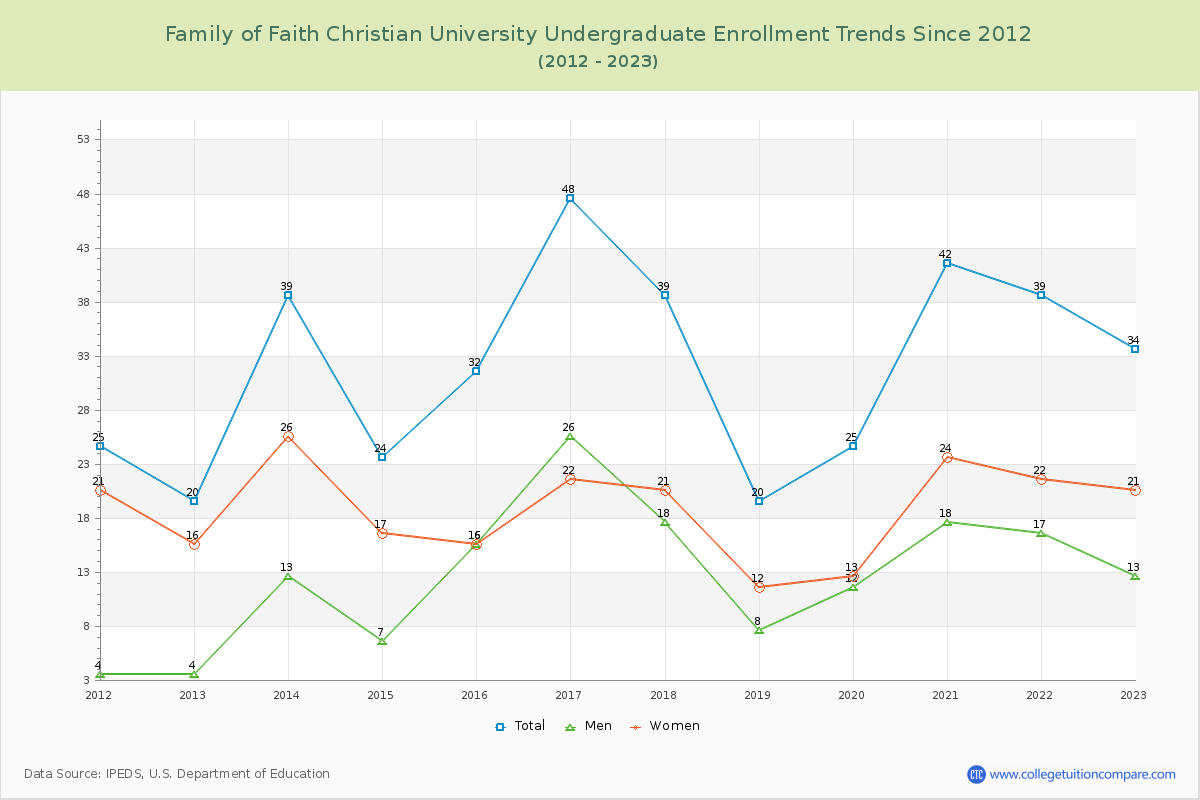
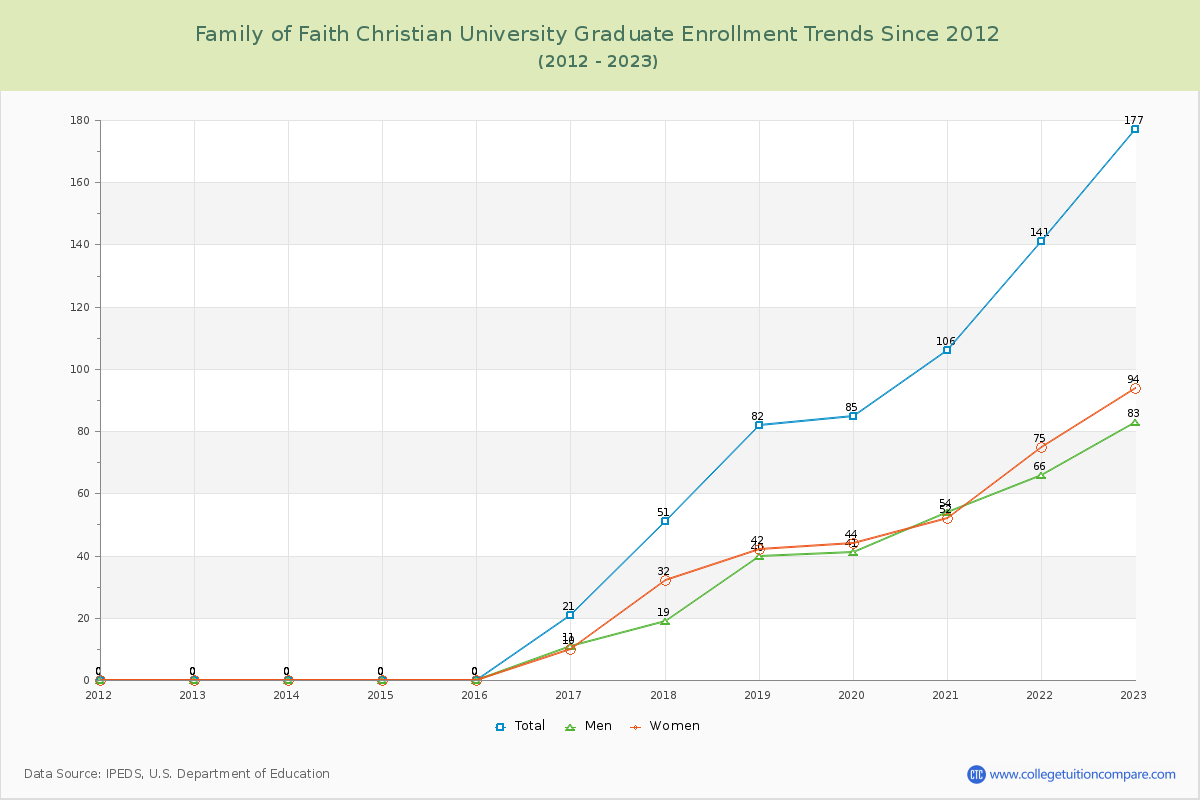
16.11% of total students is undergraduate students and 83.89% students is graduate students. The number of undergraduate students has increased by 14 and the graduate enrollment has increased by 177 over past 10 years.
The female to male ratio is 1.20 to 1 and it means that there are slightly more female students enrolled in Family of Faith Christian than male students.
The following table and chart illustrate the changes in student population by gender at Family of Faith Christian University since 2012.
| Year | Total | Undergraduate | Graduate | ||||
|---|---|---|---|---|---|---|---|
| Total | Men | Women | Total | Men | Women | ||
| 2012-13 | 20 | 20 | 4 | 16 | 0 | 0 | 0 |
| 2013-14 | 39 19 | 39 19 | 13 9 | 26 10 | 0 0 | 0 0 | 0 0 |
| 2014-15 | 24 -15 | 24 -15 | 7 -6 | 17 -9 | 0 0 | 0 0 | 0 0 |
| 2015-16 | 32 8 | 32 8 | 16 9 | 16 -1 | 0 0 | 0 0 | 0 0 |
| 2016-17 | 69 37 | 48 16 | 26 10 | 22 6 | 21 21 | 11 11 | 10 10 |
| 2017-18 | 90 21 | 39 -9 | 18 -8 | 21 -1 | 51 30 | 19 8 | 32 22 |
| 2018-19 | 102 12 | 20 -19 | 8 -10 | 12 -9 | 82 31 | 40 21 | 42 10 |
| 2019-20 | 110 8 | 25 5 | 12 4 | 13 1 | 85 3 | 41 1 | 44 2 |
| 2020-21 | 148 38 | 42 17 | 18 6 | 24 11 | 106 21 | 54 13 | 52 8 |
| 2021-22 | 180 32 | 39 -3 | 17 -1 | 22 -2 | 141 35 | 66 12 | 75 23 |
| 2022-23 | 211 31 | 34 -5 | 13 -4 | 21 -1 | 177 36 | 83 17 | 94 19 |
| Average | 93 | 33 | 14 | 19 | 60 | 29 | 32 |