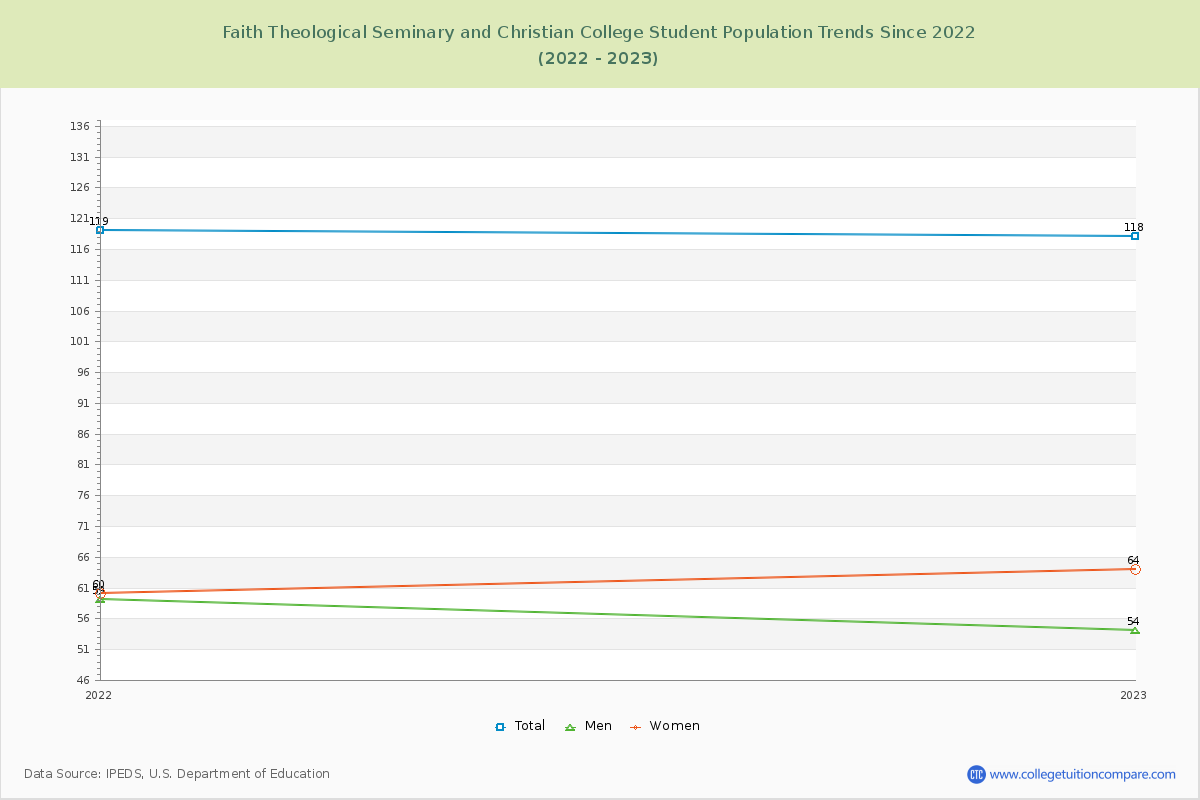
Student Population Changes
The average student population over the last 3 years is 119 where 118 students are attending the school for the academic year 2022-2023.
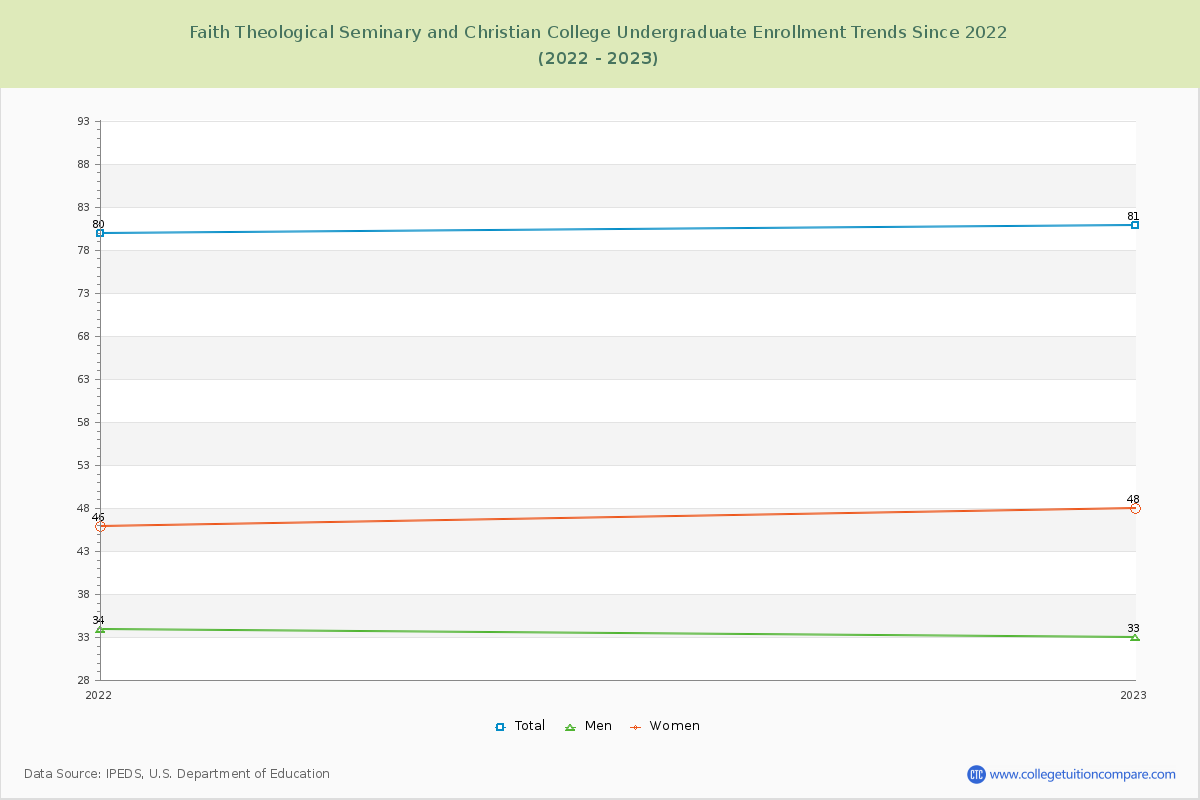
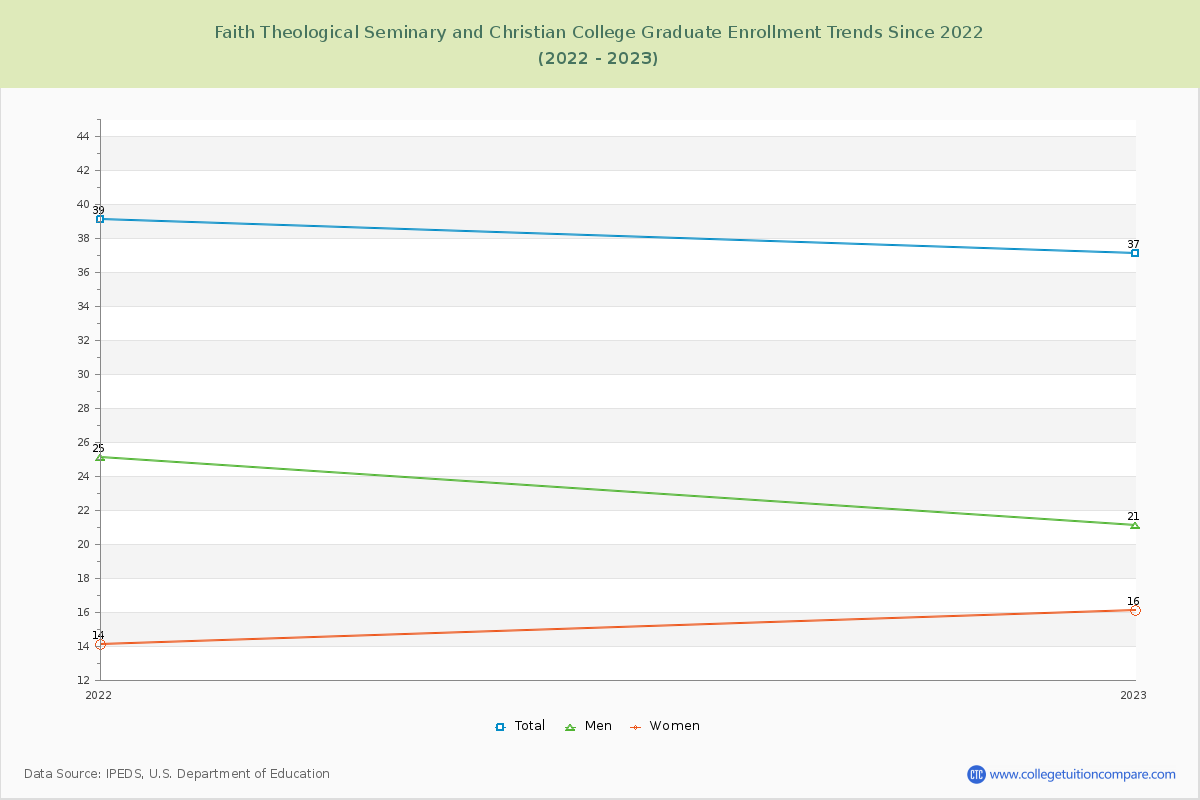
68.64% of total students is undergraduate students and 31.36% students is graduate students. The number of undergraduate students has increased by 1 and the graduate enrollment has decreased by 2 over past 10 years.
The female to male ratio is 1.19 to 1 and it means that there are slightly more female students enrolled in Faith Theological Seminary and Christian than male students.
The following table and chart illustrate the changes in student population by gender at Faith Theological Seminary and Christian College since 2021.
| Year | Total | Undergraduate | Graduate | ||||
|---|---|---|---|---|---|---|---|
| Total | Men | Women | Total | Men | Women | ||
| 2021-22 | 119 | 80 | 34 | 46 | 39 | 25 | 14 |
| 2022-23 | 118 -1 | 81 1 | 33 -1 | 48 2 | 37 -2 | 21 -4 | 16 2 |
| Average | 119 | 81 | 34 | 47 | 38 | 23 | 15 |