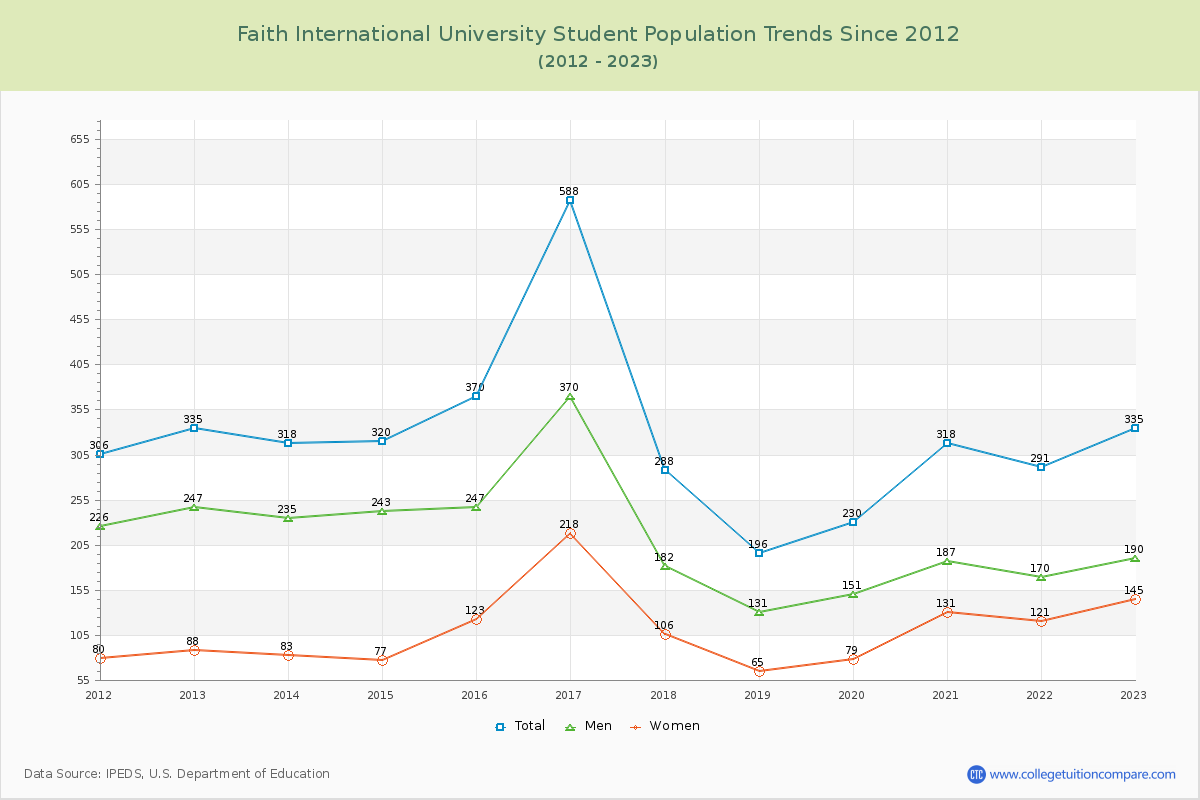
Student Population Changes
The average student population over the last 12 years is 326 where 335 students are attending the school for the academic year 2022-2023.
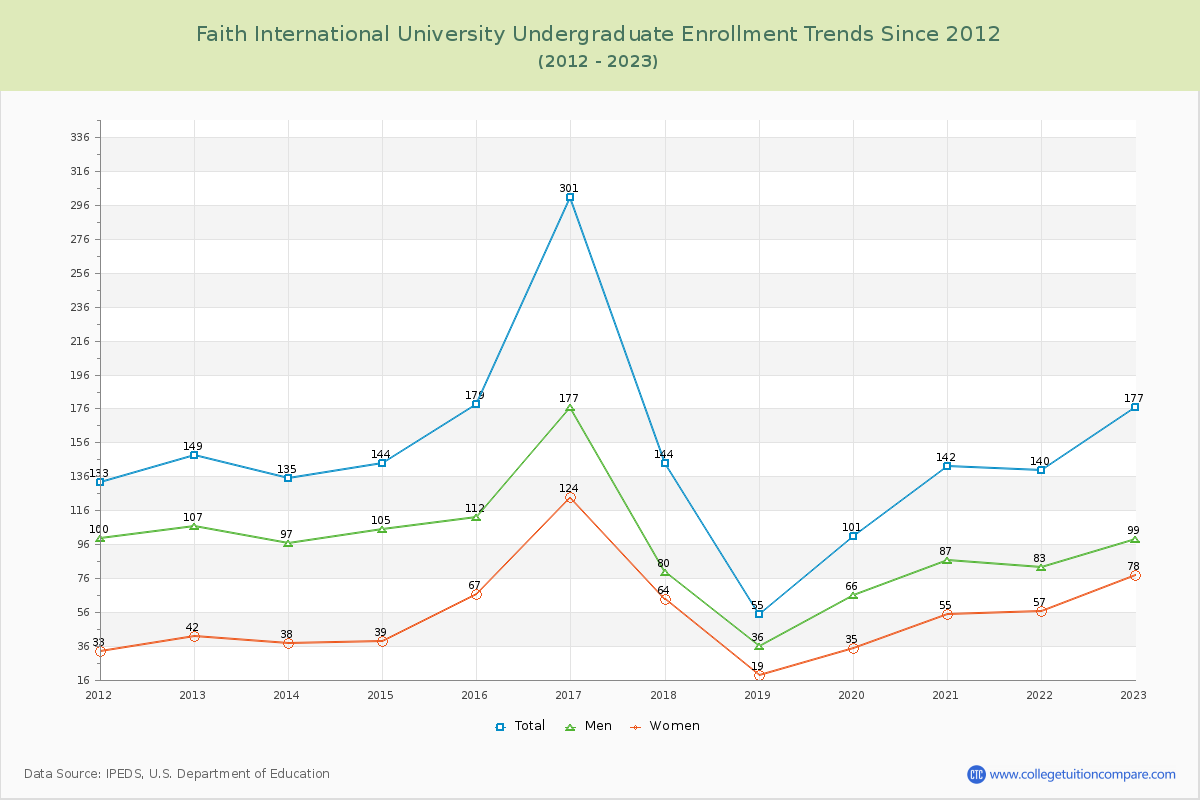
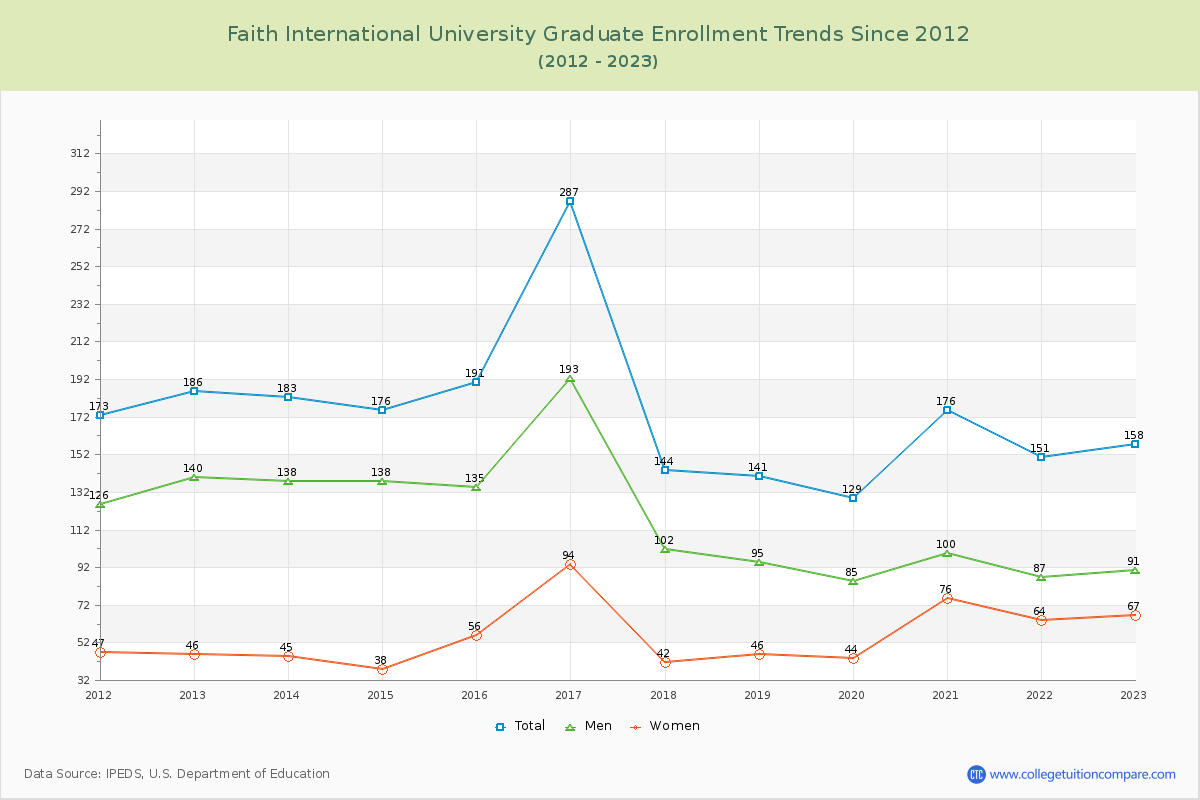
52.84% of total students is undergraduate students and 47.16% students is graduate students. The number of undergraduate students has increased by 28 and the graduate enrollment has decreased by 28 over past 10 years.
The female to male ratio is 0.76 to 1 and it means that there are more male students enrolled in Faith Seminary than female students.
The following table and chart illustrate the changes in student population by gender at Faith International University since 2012.
| Year | Total | Undergraduate | Graduate | ||||
|---|---|---|---|---|---|---|---|
| Total | Men | Women | Total | Men | Women | ||
| 2012-13 | 335 | 149 | 107 | 42 | 186 | 140 | 46 |
| 2013-14 | 318 -17 | 135 -14 | 97 -10 | 38 -4 | 183 -3 | 138 -2 | 45 -1 |
| 2014-15 | 320 2 | 144 9 | 105 8 | 39 1 | 176 -7 | 138 0 | 38 -7 |
| 2015-16 | 370 50 | 179 35 | 112 7 | 67 28 | 191 15 | 135 -3 | 56 18 |
| 2016-17 | 588 218 | 301 122 | 177 65 | 124 57 | 287 96 | 193 58 | 94 38 |
| 2017-18 | 288 -300 | 144 -157 | 80 -97 | 64 -60 | 144 -143 | 102 -91 | 42 -52 |
| 2018-19 | 196 -92 | 55 -89 | 36 -44 | 19 -45 | 141 -3 | 95 -7 | 46 4 |
| 2019-20 | 230 34 | 101 46 | 66 30 | 35 16 | 129 -12 | 85 -10 | 44 -2 |
| 2020-21 | 318 88 | 142 41 | 87 21 | 55 20 | 176 47 | 100 15 | 76 32 |
| 2021-22 | 291 -27 | 140 -2 | 83 -4 | 57 2 | 151 -25 | 87 -13 | 64 -12 |
| 2022-23 | 335 44 | 177 37 | 99 16 | 78 21 | 158 7 | 91 4 | 67 3 |
| Average | 326 | 152 | 95 | 56 | 175 | 119 | 56 |