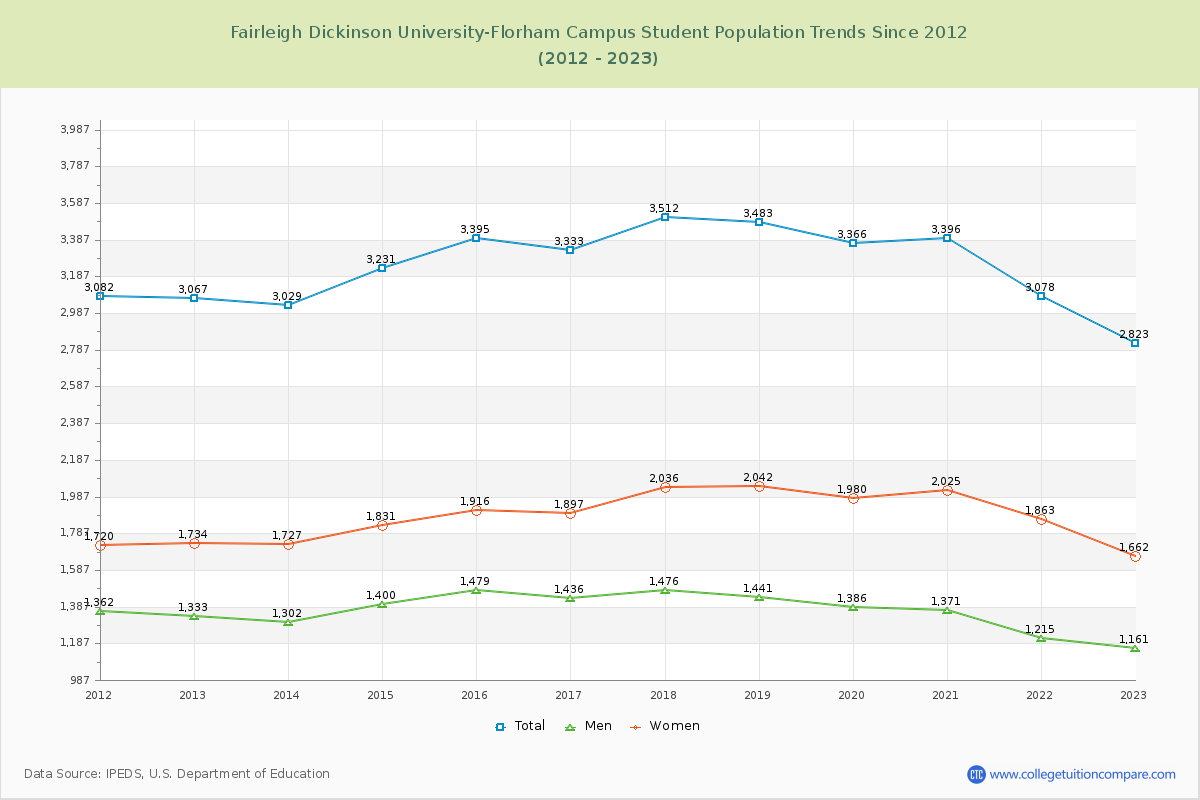
Student Population Changes
The average student population over the last 12 years is 3,247 where 2,823 students are attending the school for the academic year 2022-2023.
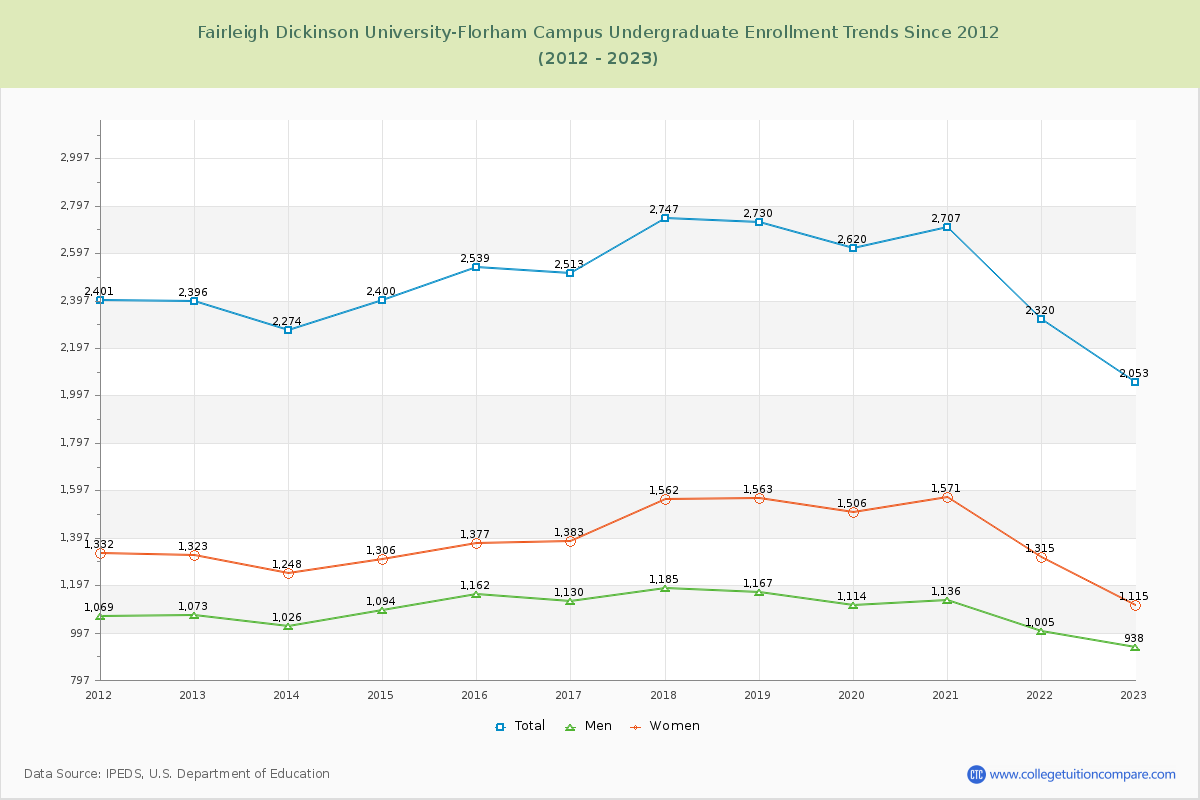
72.72% of total students is undergraduate students and 27.28% students is graduate students. The number of undergraduate students has decreased by 343 and the graduate enrollment has increased by 99 over past 10 years.
The female to male ratio is 1.43 to 1 and it means that there are more female students enrolled in FDU-Florham than male students.
The following table and chart illustrate the changes in student population by gender at Fairleigh Dickinson University-Florham Campus since 2012.
| Year | Total | Undergraduate | Graduate | ||||
|---|---|---|---|---|---|---|---|
| Total | Men | Women | Total | Men | Women | ||
| 2012-13 | 3,067 | 2,396 | 1,073 | 1,323 | 671 | 260 | 411 |
| 2013-14 | 3,029 -38 | 2,274 -122 | 1,026 -47 | 1,248 -75 | 755 84 | 276 16 | 479 68 |
| 2014-15 | 3,231 202 | 2,400 126 | 1,094 68 | 1,306 58 | 831 76 | 306 30 | 525 46 |
| 2015-16 | 3,395 164 | 2,539 139 | 1,162 68 | 1,377 71 | 856 25 | 317 11 | 539 14 |
| 2016-17 | 3,333 -62 | 2,513 -26 | 1,130 -32 | 1,383 6 | 820 -36 | 306 -11 | 514 -25 |
| 2017-18 | 3,512 179 | 2,747 234 | 1,185 55 | 1,562 179 | 765 -55 | 291 -15 | 474 -40 |
| 2018-19 | 3,483 -29 | 2,730 -17 | 1,167 -18 | 1,563 1 | 753 -12 | 274 -17 | 479 5 |
| 2019-20 | 3,366 -117 | 2,620 -110 | 1,114 -53 | 1,506 -57 | 746 -7 | 272 -2 | 474 -5 |
| 2020-21 | 3,396 30 | 2,707 87 | 1,136 22 | 1,571 65 | 689 -57 | 235 -37 | 454 -20 |
| 2021-22 | 3,078 -318 | 2,320 -387 | 1,005 -131 | 1,315 -256 | 758 69 | 210 -25 | 548 94 |
| 2022-23 | 2,823 -255 | 2,053 -267 | 938 -67 | 1,115 -200 | 770 12 | 223 13 | 547 -1 |
| Average | 3,247 | 2,482 | 1,094 | 1,388 | 765 | 270 | 495 |