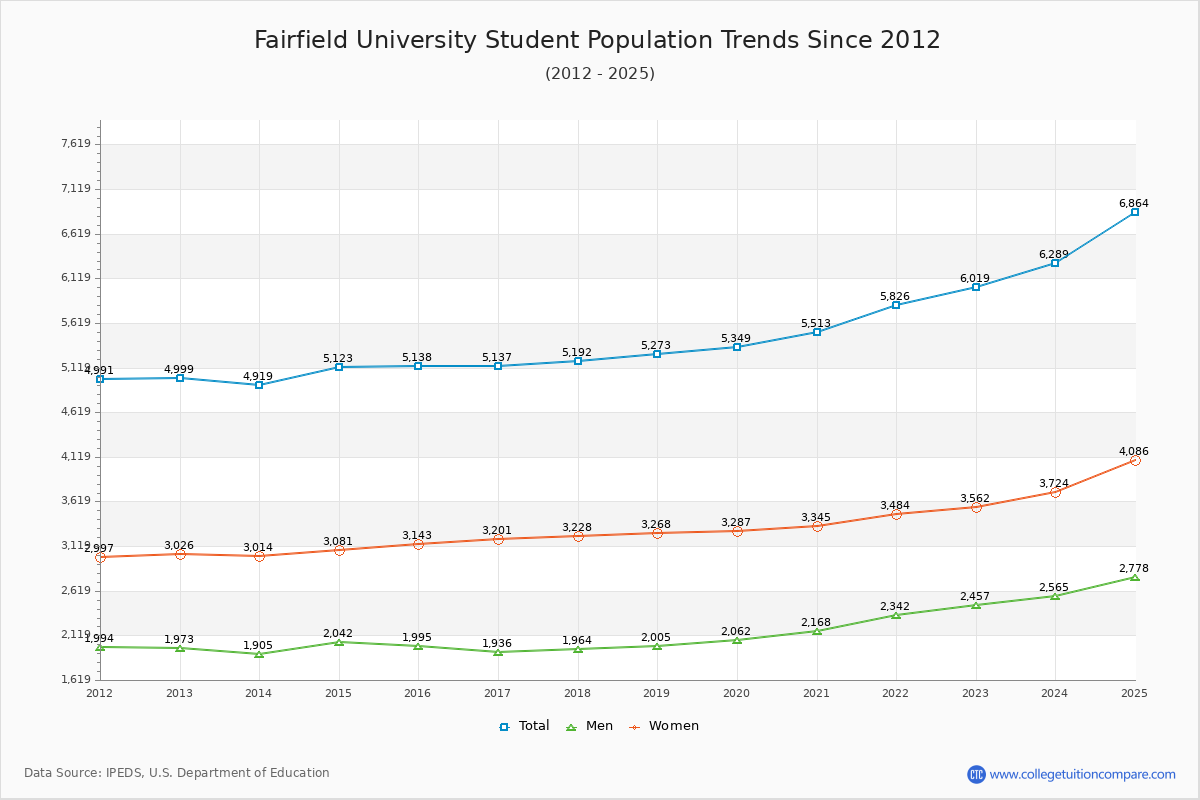
Student Population Changes
The average student population over the last 12 years is 5,317 where 6,019 students are attending the school for the academic year 2022-2023.
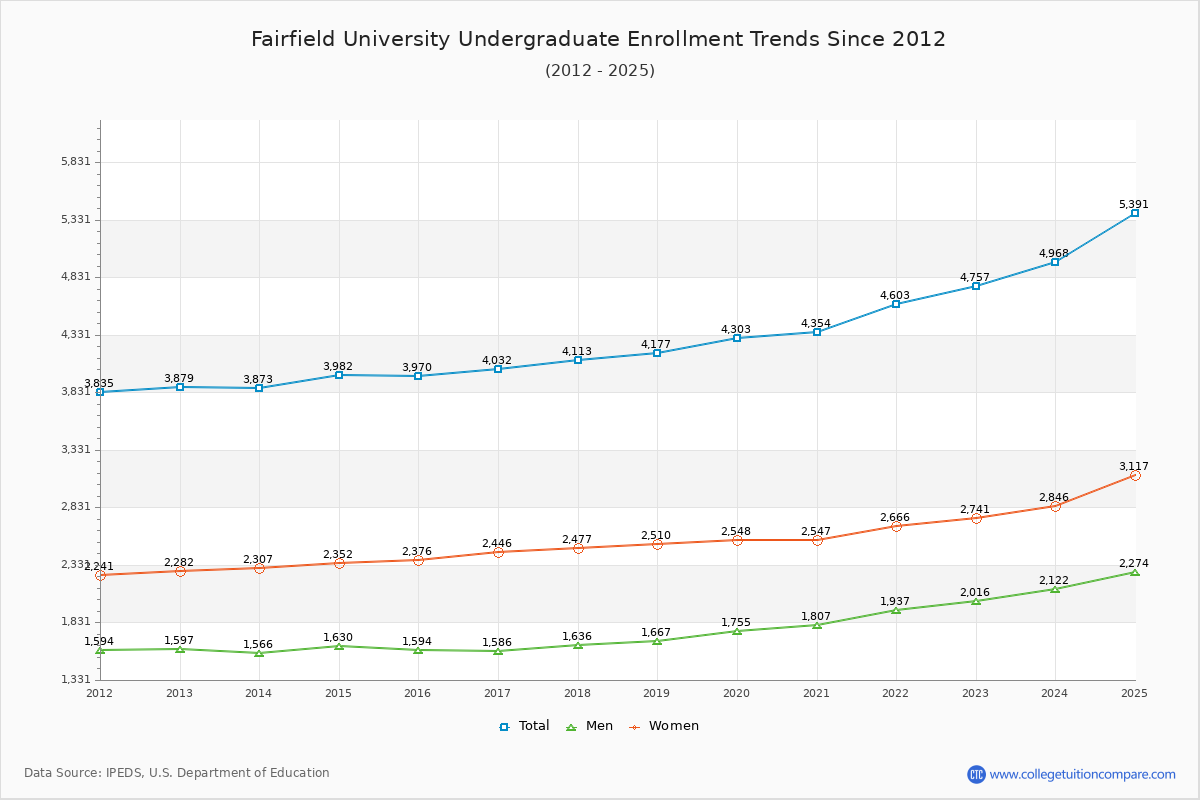
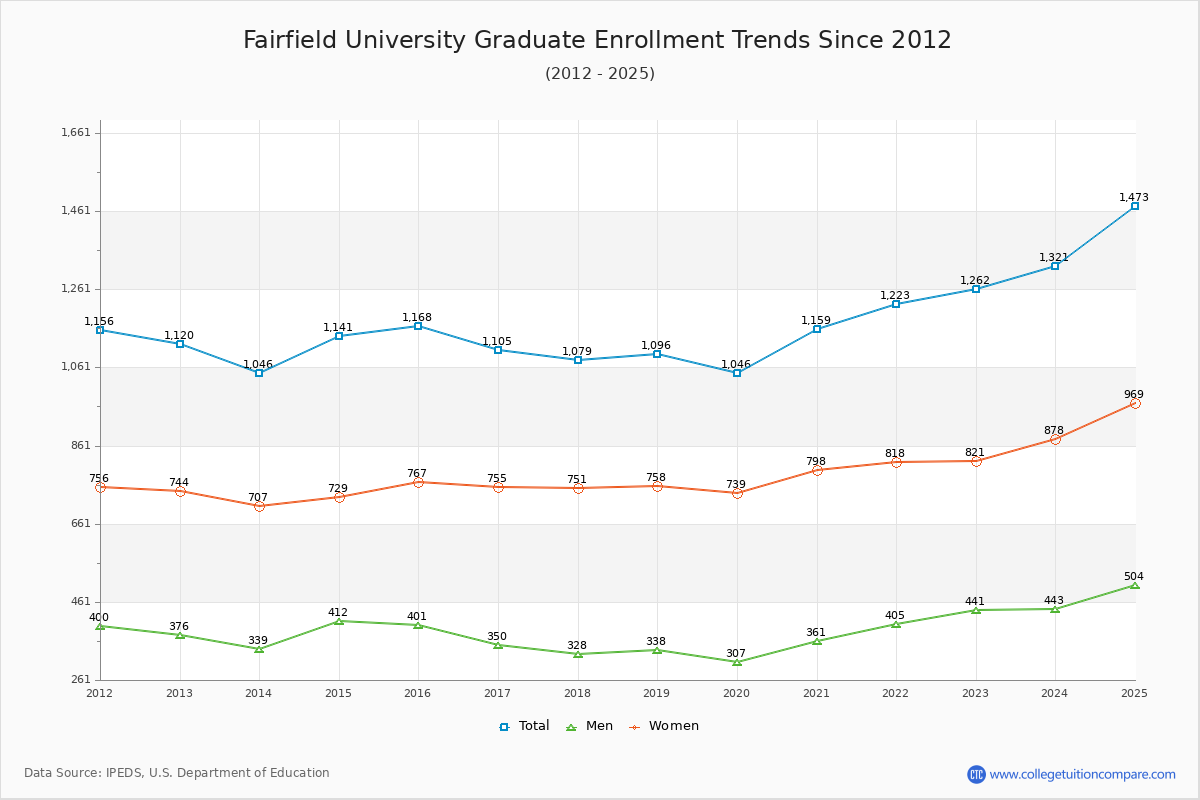
79.03% of total students is undergraduate students and 20.97% students is graduate students. The number of undergraduate students has increased by 878 and the graduate enrollment has increased by 142 over past 10 years.
The female to male ratio is 1.45 to 1 and it means that there are more female students enrolled in Fairfield than male students.
The following table and chart illustrate the changes in student population by gender at Fairfield University since 2012.
| Year | Total | Undergraduate | Graduate | ||||
|---|---|---|---|---|---|---|---|
| Total | Men | Women | Total | Men | Women | ||
| 2012-13 | 4,999 | 3,879 | 1,597 | 2,282 | 1,120 | 376 | 744 |
| 2013-14 | 4,919 -80 | 3,873 -6 | 1,566 -31 | 2,307 25 | 1,046 -74 | 339 -37 | 707 -37 |
| 2014-15 | 5,123 204 | 3,982 109 | 1,630 64 | 2,352 45 | 1,141 95 | 412 73 | 729 22 |
| 2015-16 | 5,138 15 | 3,970 -12 | 1,594 -36 | 2,376 24 | 1,168 27 | 401 -11 | 767 38 |
| 2016-17 | 5,137 -1 | 4,032 62 | 1,586 -8 | 2,446 70 | 1,105 -63 | 350 -51 | 755 -12 |
| 2017-18 | 5,192 55 | 4,113 81 | 1,636 50 | 2,477 31 | 1,079 -26 | 328 -22 | 751 -4 |
| 2018-19 | 5,273 81 | 4,177 64 | 1,667 31 | 2,510 33 | 1,096 17 | 338 10 | 758 7 |
| 2019-20 | 5,349 76 | 4,303 126 | 1,755 88 | 2,548 38 | 1,046 -50 | 307 -31 | 739 -19 |
| 2020-21 | 5,513 164 | 4,354 51 | 1,807 52 | 2,547 -1 | 1,159 113 | 361 54 | 798 59 |
| 2021-22 | 5,826 313 | 4,603 249 | 1,937 130 | 2,666 119 | 1,223 64 | 405 44 | 818 20 |
| 2022-23 | 6,019 193 | 4,757 154 | 2,016 79 | 2,741 75 | 1,262 39 | 441 36 | 821 3 |
| Average | 5,317 | 4,186 | 1,708 | 2,477 | 1,131 | 369 | 762 |