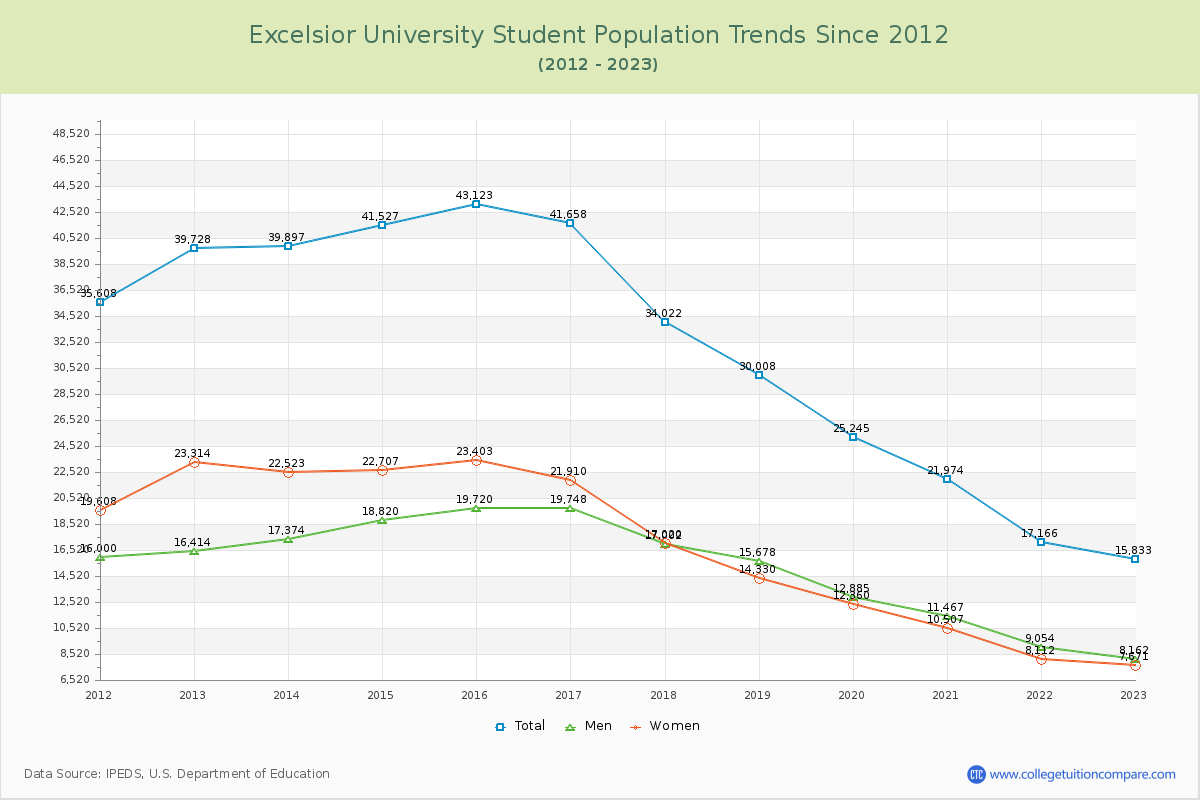
Student Population Changes
The average student population over the last 12 years is 31,835 where 15,833 students are attending the school for the academic year 2022-2023.
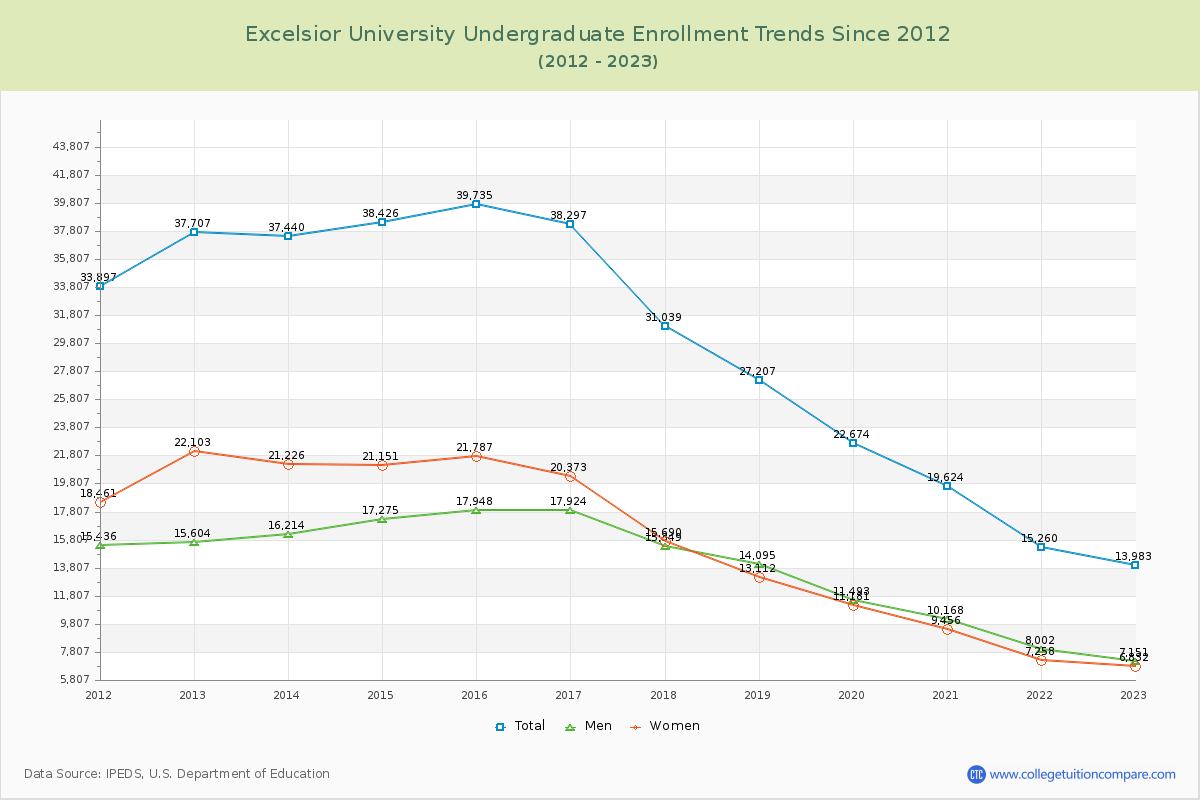
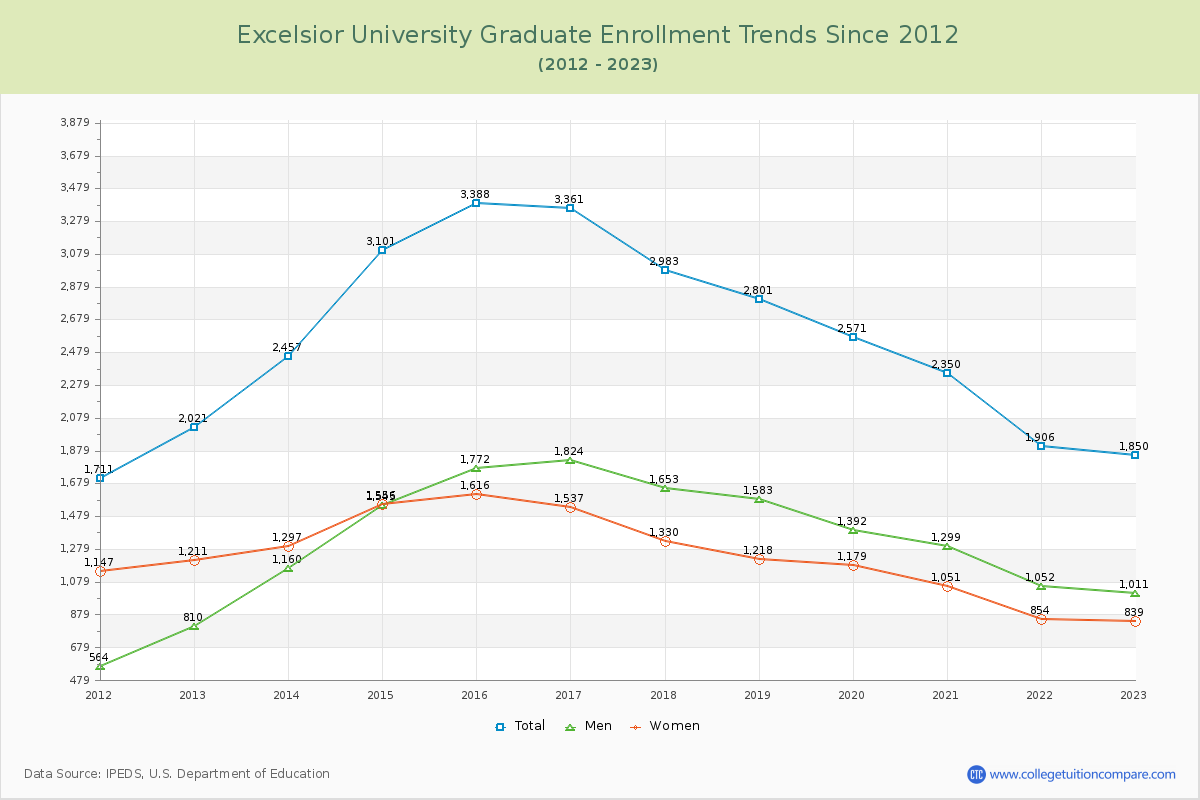
88.32% of total students is undergraduate students and 11.68% students is graduate students. The number of undergraduate students has decreased by 23,724 and the graduate enrollment has decreased by 171 over past 10 years.
The female to male ratio is 0.94 to 1 and it means that there are similar numbers of female and male students enrolled in Excelsior.
The following table and chart illustrate the changes in student population by gender at Excelsior University since 2012.
| Year | Total | Undergraduate | Graduate | ||||
|---|---|---|---|---|---|---|---|
| Total | Men | Women | Total | Men | Women | ||
| 2012-13 | 39,728 | 37,707 | 15,604 | 22,103 | 2,021 | 810 | 1,211 |
| 2013-14 | 39,897 169 | 37,440 -267 | 16,214 610 | 21,226 -877 | 2,457 436 | 1,160 350 | 1,297 86 |
| 2014-15 | 41,527 1,630 | 38,426 986 | 17,275 1,061 | 21,151 -75 | 3,101 644 | 1,545 385 | 1,556 259 |
| 2015-16 | 43,123 1,596 | 39,735 1,309 | 17,948 673 | 21,787 636 | 3,388 287 | 1,772 227 | 1,616 60 |
| 2016-17 | 41,658 -1,465 | 38,297 -1,438 | 17,924 -24 | 20,373 -1,414 | 3,361 -27 | 1,824 52 | 1,537 -79 |
| 2017-18 | 34,022 -7,636 | 31,039 -7,258 | 15,349 -2,575 | 15,690 -4,683 | 2,983 -378 | 1,653 -171 | 1,330 -207 |
| 2018-19 | 30,008 -4,014 | 27,207 -3,832 | 14,095 -1,254 | 13,112 -2,578 | 2,801 -182 | 1,583 -70 | 1,218 -112 |
| 2019-20 | 25,245 -4,763 | 22,674 -4,533 | 11,493 -2,602 | 11,181 -1,931 | 2,571 -230 | 1,392 -191 | 1,179 -39 |
| 2020-21 | 21,974 -3,271 | 19,624 -3,050 | 10,168 -1,325 | 9,456 -1,725 | 2,350 -221 | 1,299 -93 | 1,051 -128 |
| 2021-22 | 17,166 -4,808 | 15,260 -4,364 | 8,002 -2,166 | 7,258 -2,198 | 1,906 -444 | 1,052 -247 | 854 -197 |
| 2022-23 | 15,833 -1,333 | 13,983 -1,277 | 7,151 -851 | 6,832 -426 | 1,850 -56 | 1,011 -41 | 839 -15 |
| Average | 31,835 | 29,217 | 13,748 | 15,470 | 2,617 | 1,373 | 1,244 |