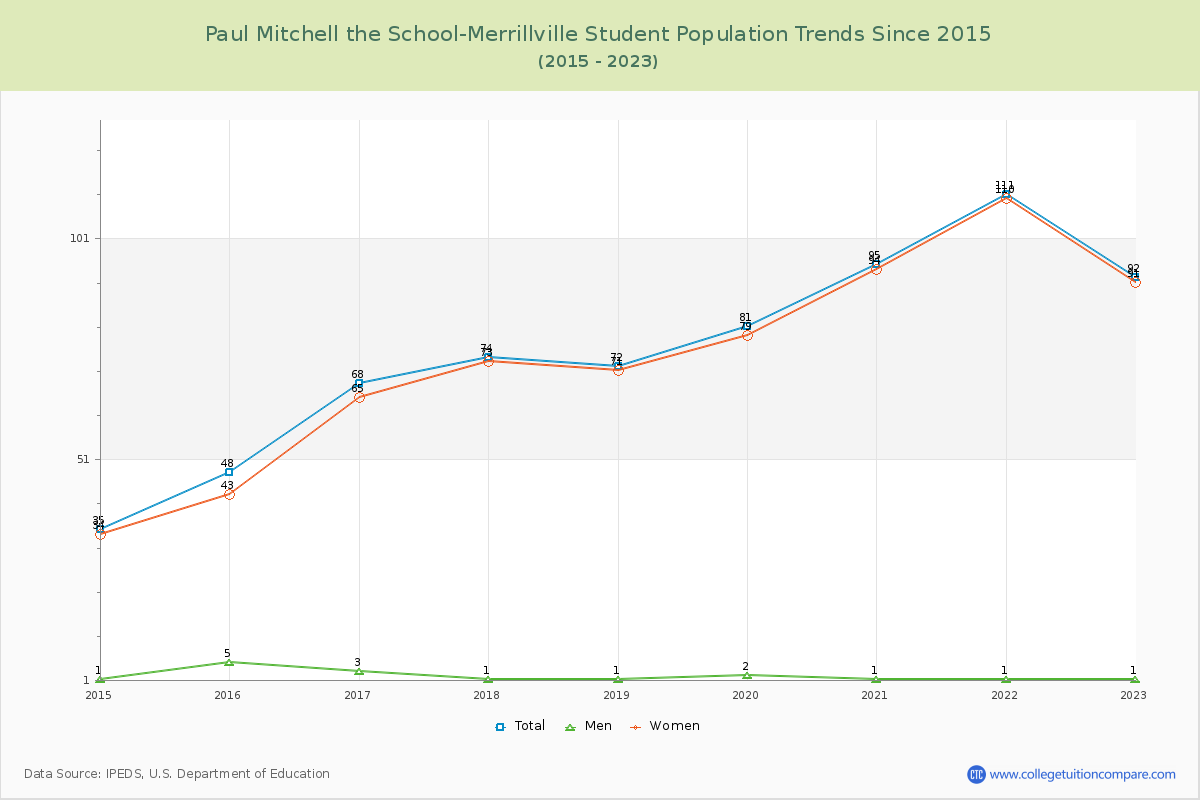
Student Population Changes
The average student population over the last 10 years is 75 where 92 students are attending the school for the academic year 2022-2023.
The female to male ratio is 91.00 to 1 and it means that there are far more female students enrolled in Paul Mitchell the School-Merrillville than male students.
The following table and chart illustrate the changes in student population by gender at Paul Mitchell the School-Merrillville since 2014.
| Year | Total | Men | Women |
|---|---|---|---|
| 2014-15 | 35 | 1 | 34 |
| 2015-16 | 48 13 | 5 4 | 43 9 |
| 2016-17 | 68 20 | 3 -2 | 65 22 |
| 2017-18 | 74 6 | 1 -2 | 73 8 |
| 2018-19 | 72 -2 | 1 0 | 71 -2 |
| 2019-20 | 81 9 | 2 1 | 79 8 |
| 2020-21 | 95 14 | 1 -1 | 94 15 |
| 2021-22 | 111 16 | 1 0 | 110 16 |
| 2022-23 | 92 -19 | 1 0 | 91 -19 |
| Average | 75 | 2 | 73 |