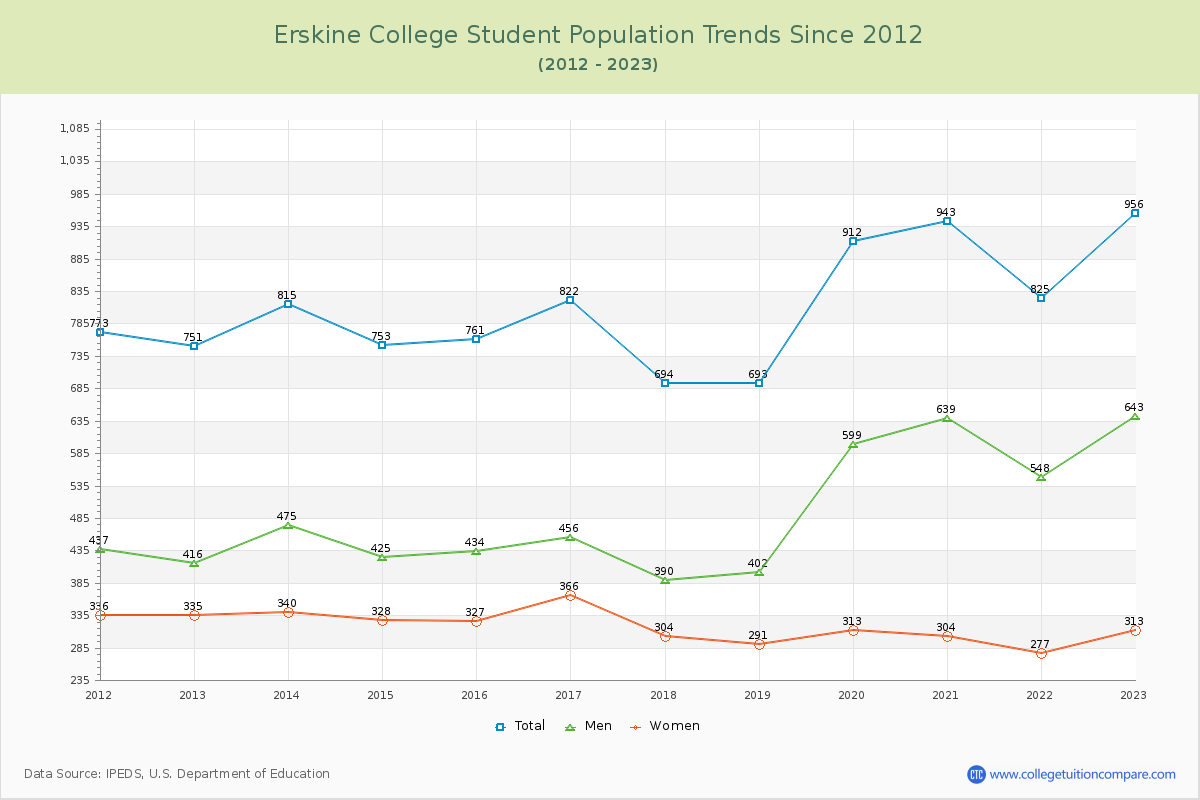
Student Population Changes
The average student population over the last 12 years is 811 where 956 students are attending the school for the academic year 2022-2023.
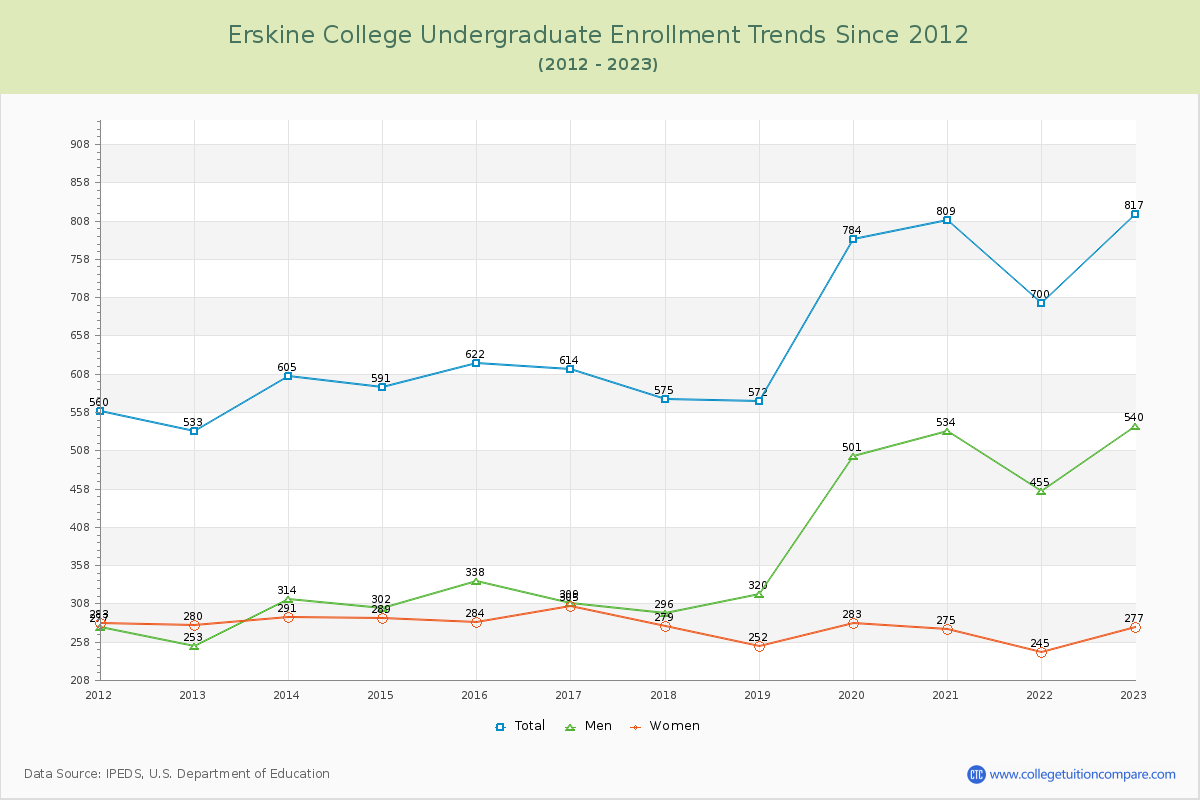
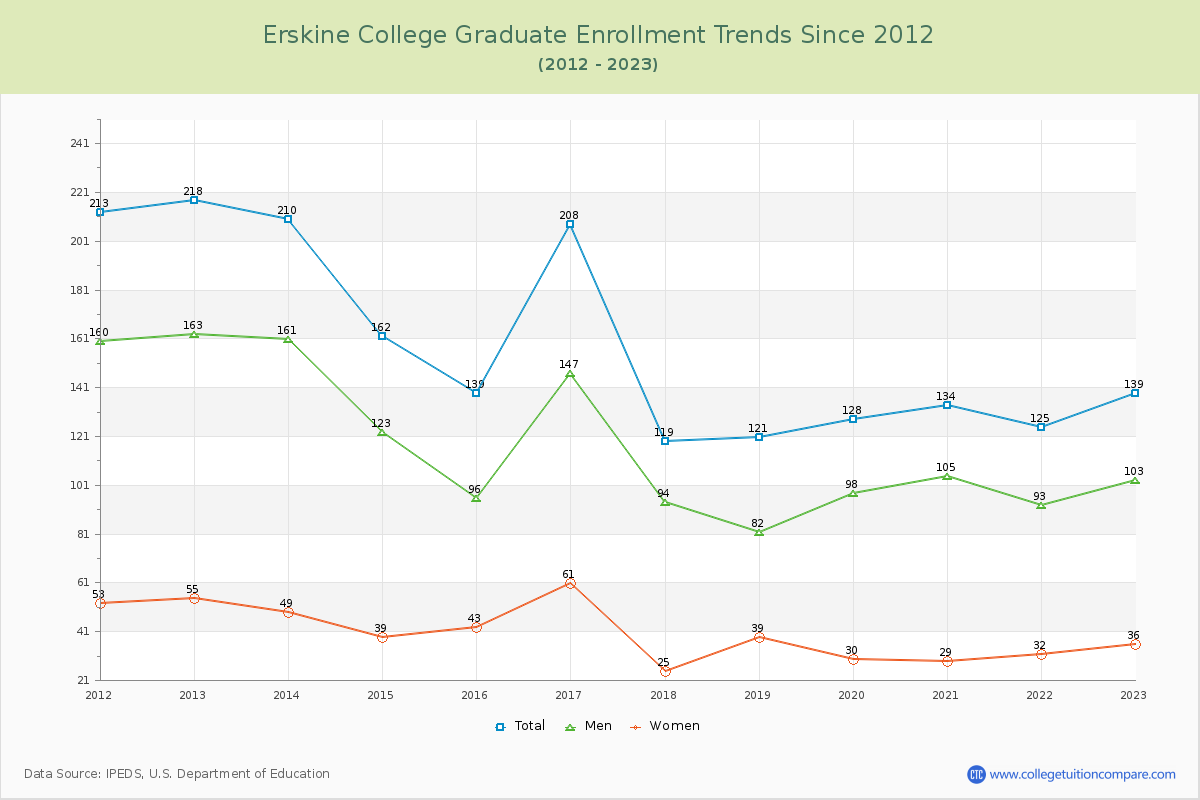
85.46% of total students is undergraduate students and 14.54% students is graduate students. The number of undergraduate students has increased by 284 and the graduate enrollment has decreased by 79 over past 10 years.
The female to male ratio is 0.49 to 1 and it means that there are far more male students enrolled in Erskine than female students.
The following table and chart illustrate the changes in student population by gender at Erskine College since 2012.
| Year | Total | Undergraduate | Graduate | ||||
|---|---|---|---|---|---|---|---|
| Total | Men | Women | Total | Men | Women | ||
| 2012-13 | 751 | 533 | 253 | 280 | 218 | 163 | 55 |
| 2013-14 | 815 64 | 605 72 | 314 61 | 291 11 | 210 -8 | 161 -2 | 49 -6 |
| 2014-15 | 753 -62 | 591 -14 | 302 -12 | 289 -2 | 162 -48 | 123 -38 | 39 -10 |
| 2015-16 | 761 8 | 622 31 | 338 36 | 284 -5 | 139 -23 | 96 -27 | 43 4 |
| 2016-17 | 822 61 | 614 -8 | 309 -29 | 305 21 | 208 69 | 147 51 | 61 18 |
| 2017-18 | 694 -128 | 575 -39 | 296 -13 | 279 -26 | 119 -89 | 94 -53 | 25 -36 |
| 2018-19 | 693 -1 | 572 -3 | 320 24 | 252 -27 | 121 2 | 82 -12 | 39 14 |
| 2019-20 | 912 219 | 784 212 | 501 181 | 283 31 | 128 7 | 98 16 | 30 -9 |
| 2020-21 | 943 31 | 809 25 | 534 33 | 275 -8 | 134 6 | 105 7 | 29 -1 |
| 2021-22 | 825 -118 | 700 -109 | 455 -79 | 245 -30 | 125 -9 | 93 -12 | 32 3 |
| 2022-23 | 956 131 | 817 117 | 540 85 | 277 32 | 139 14 | 103 10 | 36 4 |
| Average | 811 | 657 | 378 | 278 | 155 | 115 | 40 |