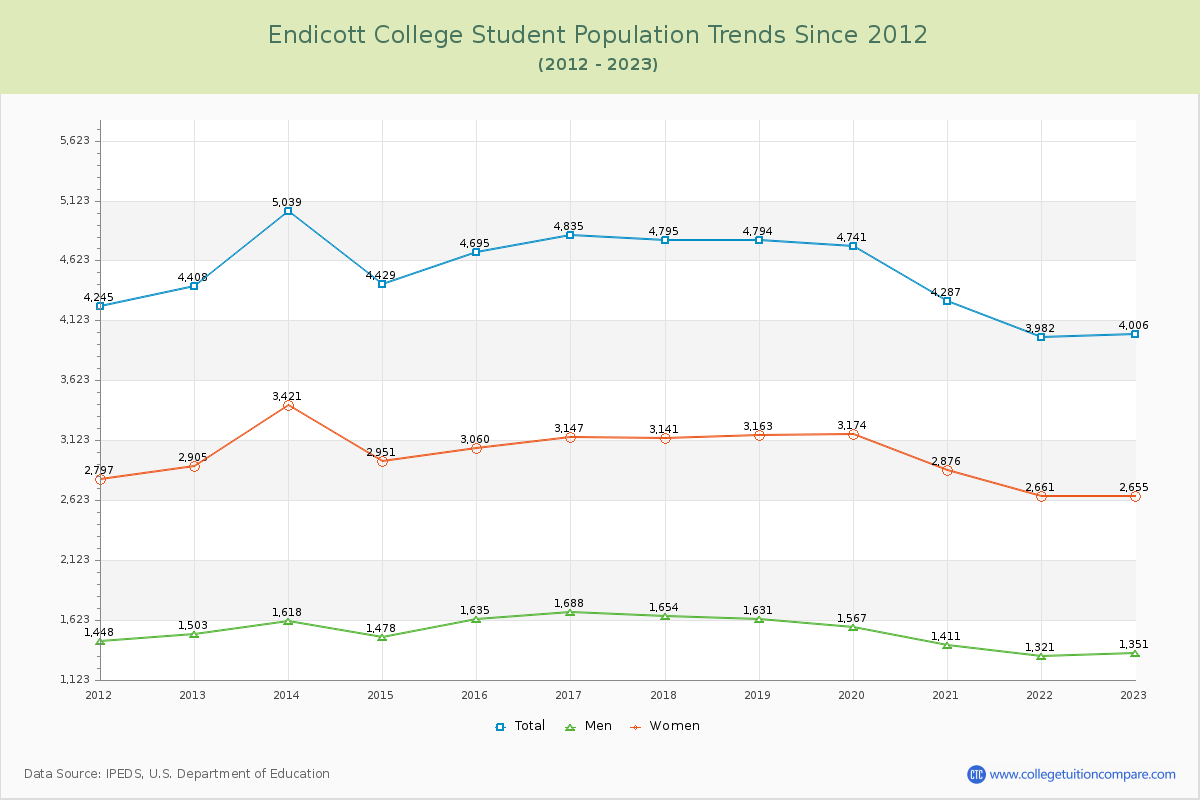
Student Population Changes
The average student population over the last 12 years is 4,546 where 4,006 students are attending the school for the academic year 2022-2023.
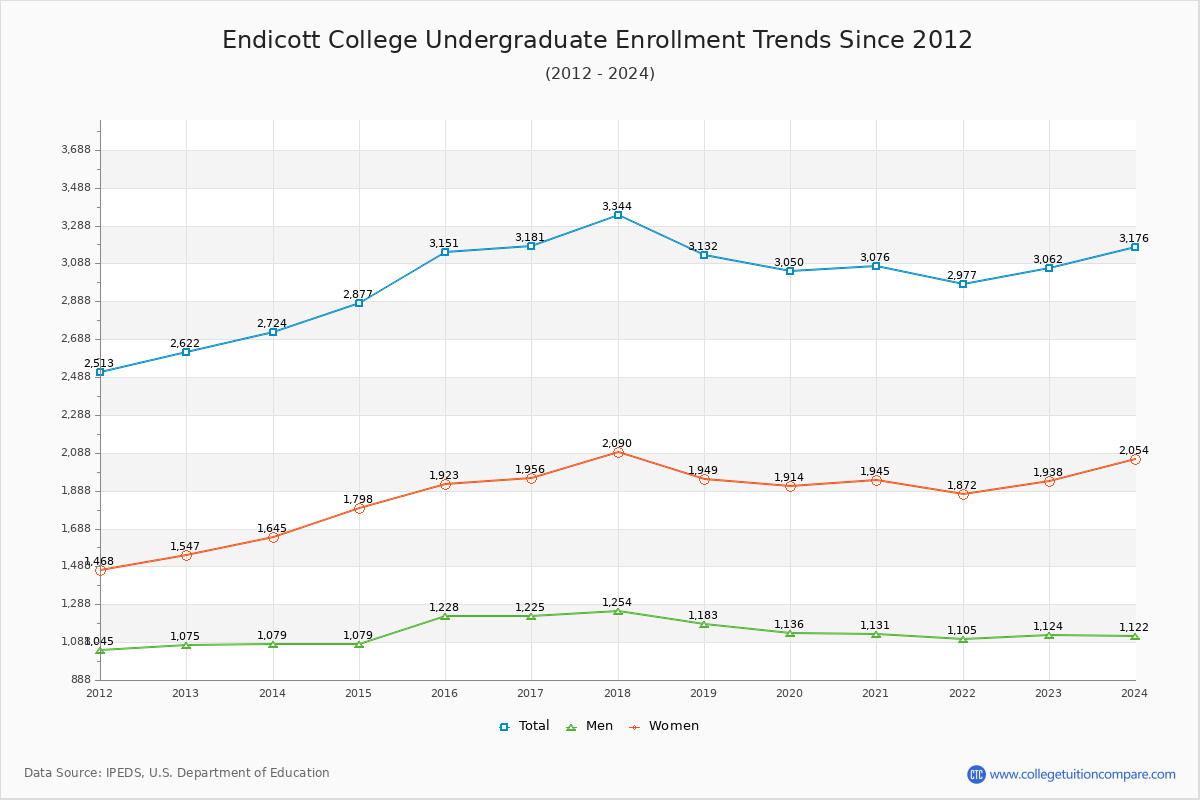
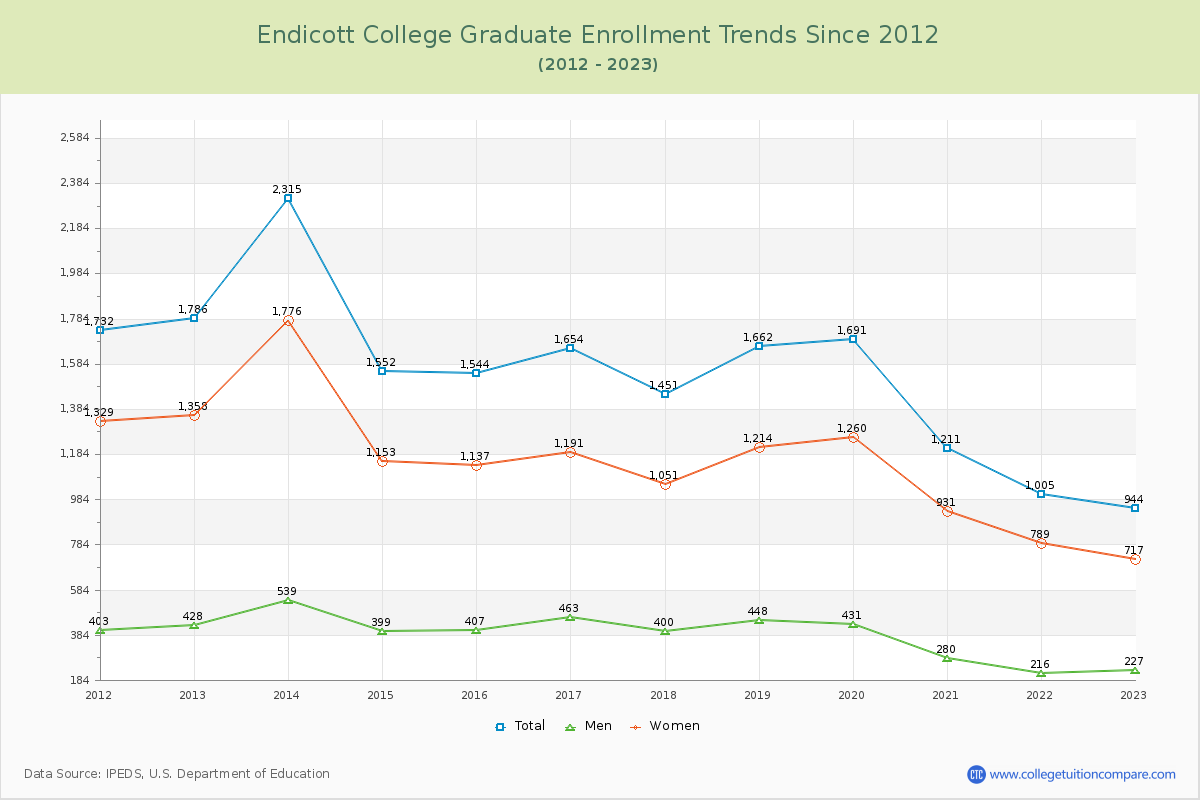
76.44% of total students is undergraduate students and 23.56% students is graduate students. The number of undergraduate students has increased by 440 and the graduate enrollment has decreased by 842 over past 10 years.
The female to male ratio is 1.97 to 1 and it means that there are more female students enrolled in Endicott than male students.
The following table and chart illustrate the changes in student population by gender at Endicott College since 2012.
| Year | Total | Undergraduate | Graduate | ||||
|---|---|---|---|---|---|---|---|
| Total | Men | Women | Total | Men | Women | ||
| 2012-13 | 4,408 | 2,622 | 1,075 | 1,547 | 1,786 | 428 | 1,358 |
| 2013-14 | 5,039 631 | 2,724 102 | 1,079 4 | 1,645 98 | 2,315 529 | 539 111 | 1,776 418 |
| 2014-15 | 4,429 -610 | 2,877 153 | 1,079 0 | 1,798 153 | 1,552 -763 | 399 -140 | 1,153 -623 |
| 2015-16 | 4,695 266 | 3,151 274 | 1,228 149 | 1,923 125 | 1,544 -8 | 407 8 | 1,137 -16 |
| 2016-17 | 4,835 140 | 3,181 30 | 1,225 -3 | 1,956 33 | 1,654 110 | 463 56 | 1,191 54 |
| 2017-18 | 4,795 -40 | 3,344 163 | 1,254 29 | 2,090 134 | 1,451 -203 | 400 -63 | 1,051 -140 |
| 2018-19 | 4,794 -1 | 3,132 -212 | 1,183 -71 | 1,949 -141 | 1,662 211 | 448 48 | 1,214 163 |
| 2019-20 | 4,741 -53 | 3,050 -82 | 1,136 -47 | 1,914 -35 | 1,691 29 | 431 -17 | 1,260 46 |
| 2020-21 | 4,287 -454 | 3,076 26 | 1,131 -5 | 1,945 31 | 1,211 -480 | 280 -151 | 931 -329 |
| 2021-22 | 3,982 -305 | 2,977 -99 | 1,105 -26 | 1,872 -73 | 1,005 -206 | 216 -64 | 789 -142 |
| 2022-23 | 4,006 24 | 3,062 85 | 1,124 19 | 1,938 66 | 944 -61 | 227 11 | 717 -72 |
| Average | 4,546 | 3,018 | 1,147 | 1,871 | 1,529 | 385 | 1,143 |