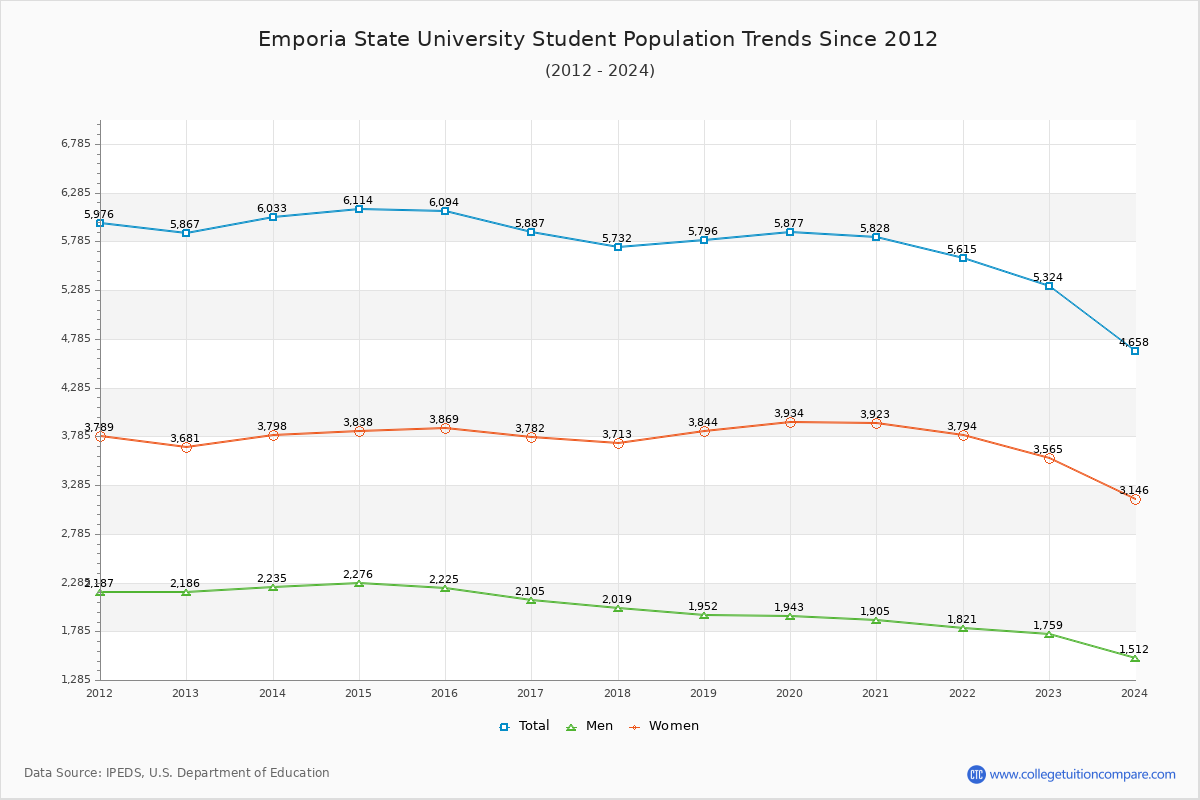
Student Population Changes
The average student population over the last 12 years is 5,833 where 5,324 students are attending the school for the academic year 2022-2023.
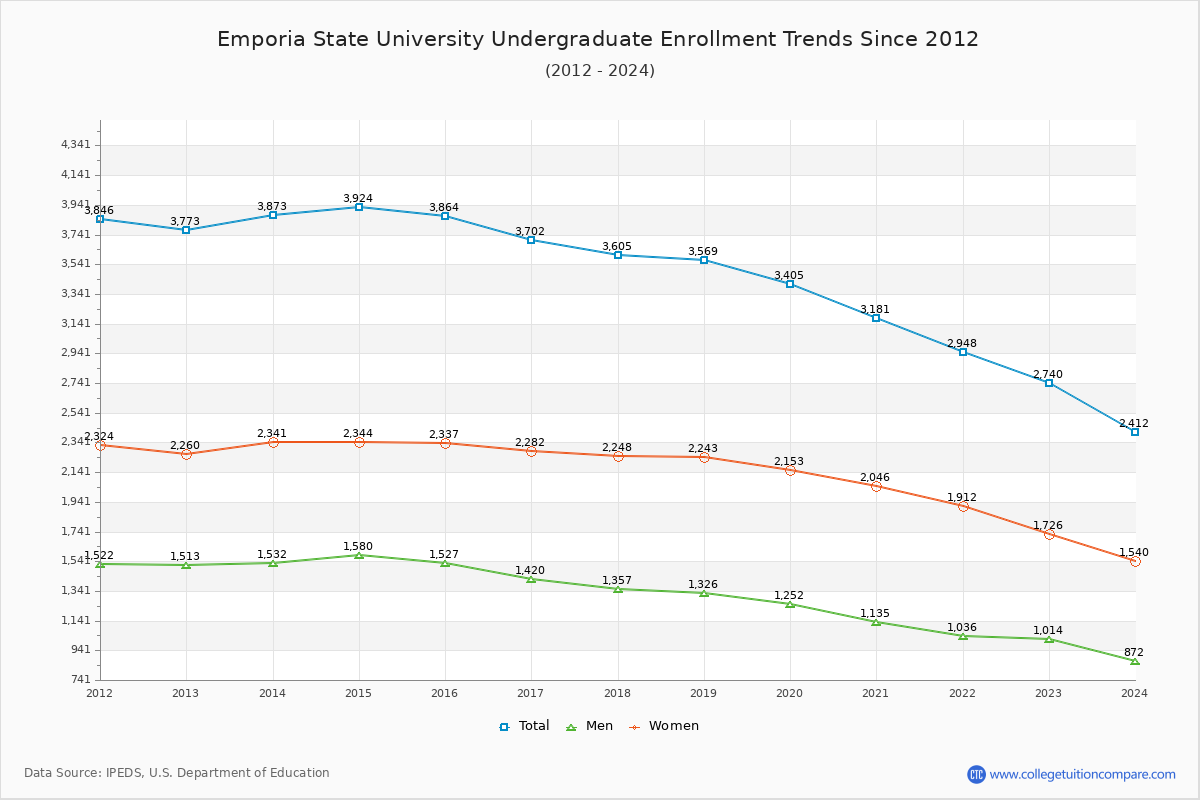
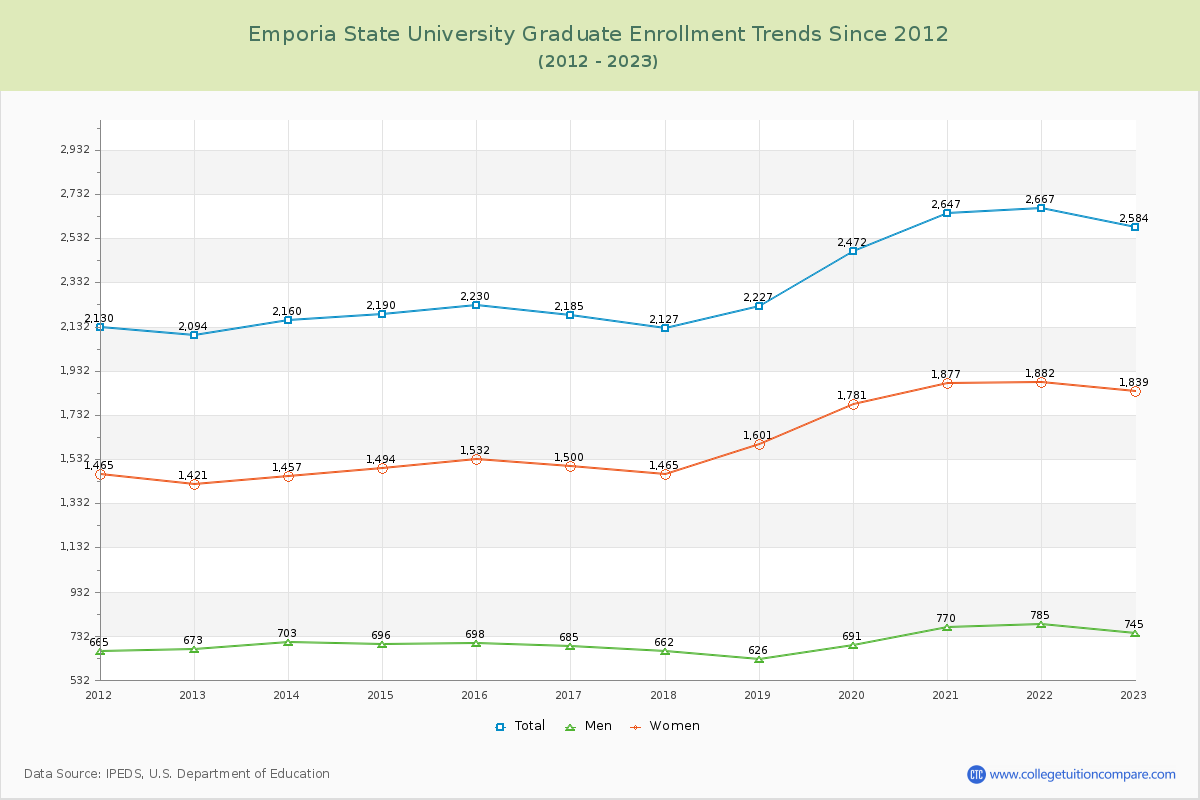
51.47% of total students is undergraduate students and 48.53% students is graduate students. The number of undergraduate students has decreased by 1,033 and the graduate enrollment has increased by 490 over past 10 years.
The female to male ratio is 2.03 to 1 and it means that there are far more female students enrolled in ESU than male students.
The following table and chart illustrate the changes in student population by gender at Emporia State University since 2012.
| Year | Total | Undergraduate | Graduate | ||||
|---|---|---|---|---|---|---|---|
| Total | Men | Women | Total | Men | Women | ||
| 2012-13 | 5,867 | 3,773 | 1,513 | 2,260 | 2,094 | 673 | 1,421 |
| 2013-14 | 6,033 166 | 3,873 100 | 1,532 19 | 2,341 81 | 2,160 66 | 703 30 | 1,457 36 |
| 2014-15 | 6,114 81 | 3,924 51 | 1,580 48 | 2,344 3 | 2,190 30 | 696 -7 | 1,494 37 |
| 2015-16 | 6,094 -20 | 3,864 -60 | 1,527 -53 | 2,337 -7 | 2,230 40 | 698 2 | 1,532 38 |
| 2016-17 | 5,887 -207 | 3,702 -162 | 1,420 -107 | 2,282 -55 | 2,185 -45 | 685 -13 | 1,500 -32 |
| 2017-18 | 5,732 -155 | 3,605 -97 | 1,357 -63 | 2,248 -34 | 2,127 -58 | 662 -23 | 1,465 -35 |
| 2018-19 | 5,796 64 | 3,569 -36 | 1,326 -31 | 2,243 -5 | 2,227 100 | 626 -36 | 1,601 136 |
| 2019-20 | 5,877 81 | 3,405 -164 | 1,252 -74 | 2,153 -90 | 2,472 245 | 691 65 | 1,781 180 |
| 2020-21 | 5,828 -49 | 3,181 -224 | 1,135 -117 | 2,046 -107 | 2,647 175 | 770 79 | 1,877 96 |
| 2021-22 | 5,615 -213 | 2,948 -233 | 1,036 -99 | 1,912 -134 | 2,667 20 | 785 15 | 1,882 5 |
| 2022-23 | 5,324 -291 | 2,740 -208 | 1,014 -22 | 1,726 -186 | 2,584 -83 | 745 -40 | 1,839 -43 |
| Average | 5,833 | 3,508 | 1,336 | 2,172 | 2,326 | 703 | 1,623 |