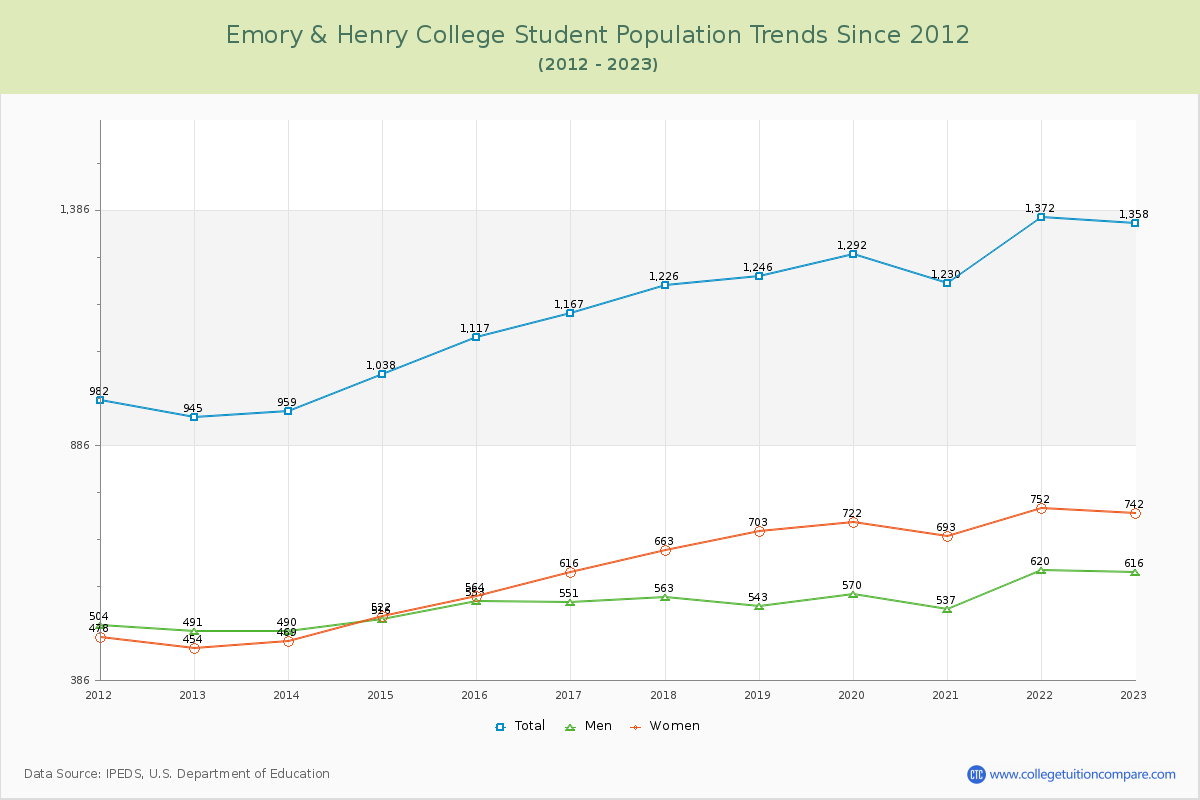
Student Population Changes
The average student population over the last 12 years is 1,177 where 1,358 students are attending the school for the academic year 2022-2023.
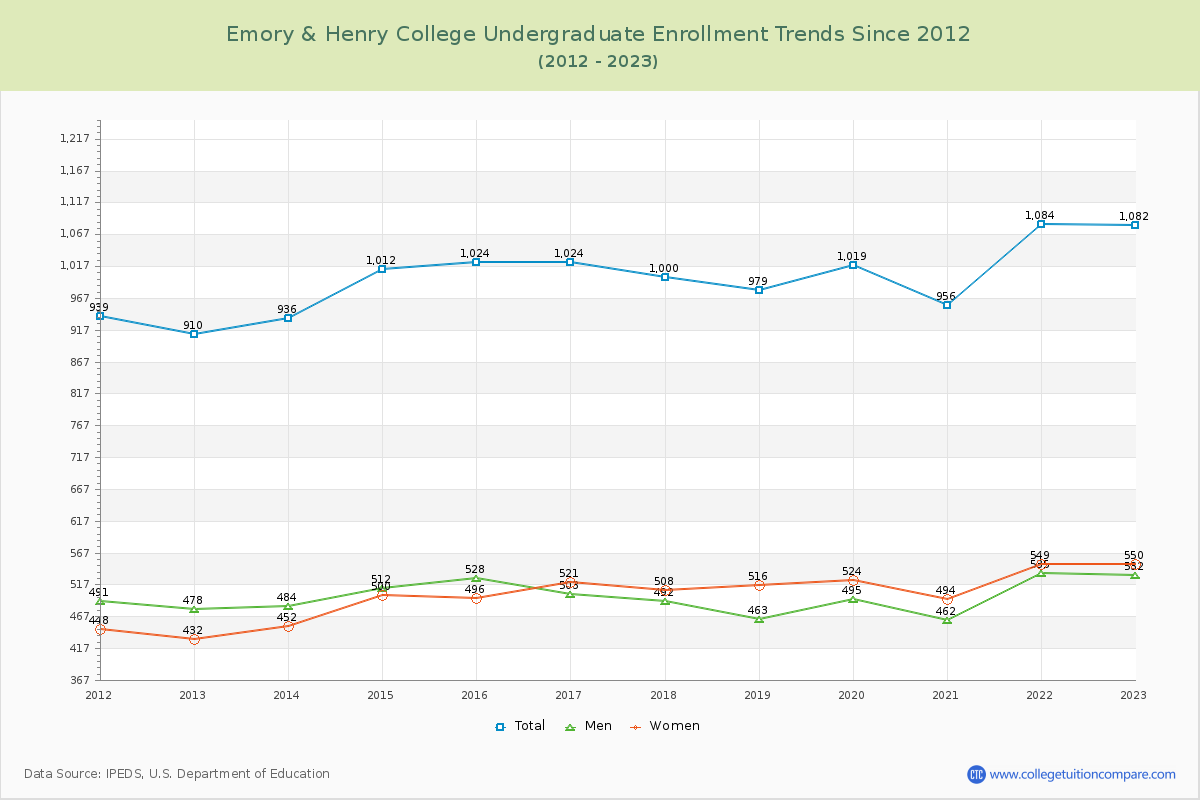
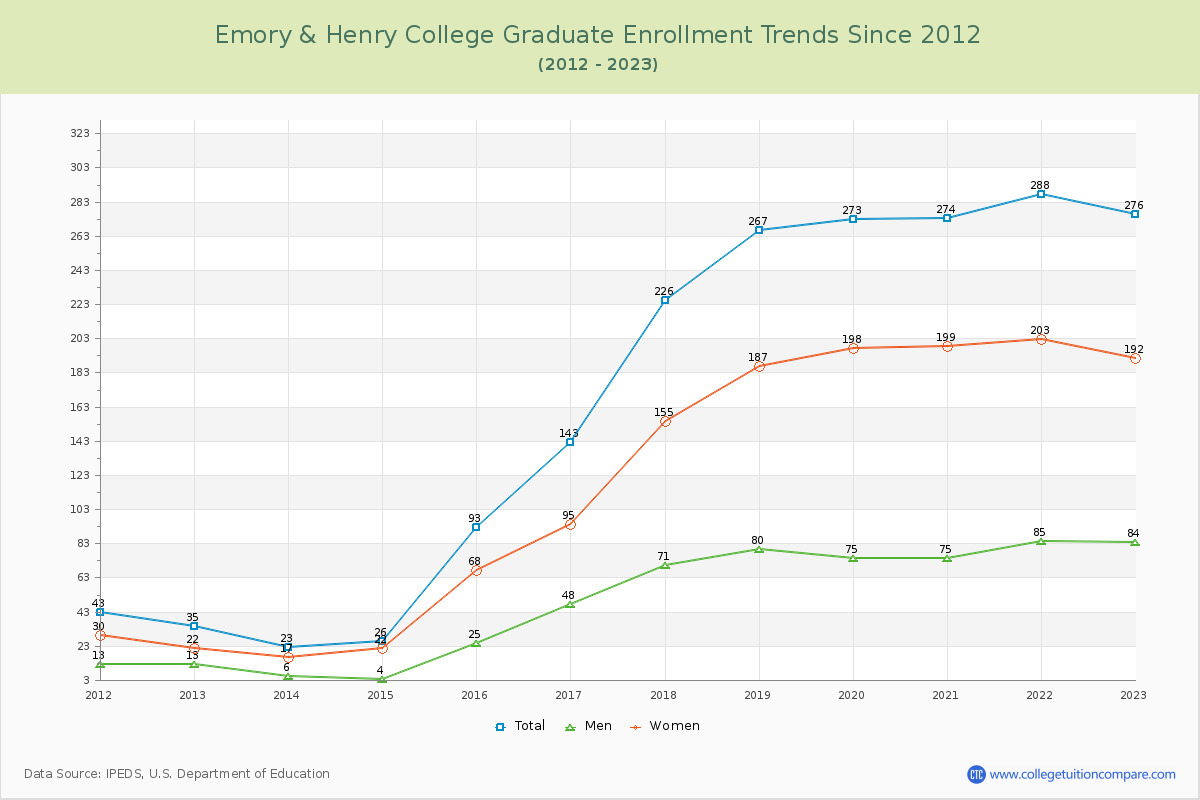
79.68% of total students is undergraduate students and 20.32% students is graduate students. The number of undergraduate students has increased by 172 and the graduate enrollment has increased by 241 over past 10 years.
The female to male ratio is 1.20 to 1 and it means that there are slightly more female students enrolled in Emory & Henry than male students.
The following table and chart illustrate the changes in student population by gender at Emory & Henry College since 2012.
| Year | Total | Undergraduate | Graduate | ||||
|---|---|---|---|---|---|---|---|
| Total | Men | Women | Total | Men | Women | ||
| 2012-13 | 945 | 910 | 478 | 432 | 35 | 13 | 22 |
| 2013-14 | 959 14 | 936 26 | 484 6 | 452 20 | 23 -12 | 6 -7 | 17 -5 |
| 2014-15 | 1,038 79 | 1,012 76 | 512 28 | 500 48 | 26 3 | 4 -2 | 22 5 |
| 2015-16 | 1,117 79 | 1,024 12 | 528 16 | 496 -4 | 93 67 | 25 21 | 68 46 |
| 2016-17 | 1,167 50 | 1,024 0 | 503 -25 | 521 25 | 143 50 | 48 23 | 95 27 |
| 2017-18 | 1,226 59 | 1,000 -24 | 492 -11 | 508 -13 | 226 83 | 71 23 | 155 60 |
| 2018-19 | 1,246 20 | 979 -21 | 463 -29 | 516 8 | 267 41 | 80 9 | 187 32 |
| 2019-20 | 1,292 46 | 1,019 40 | 495 32 | 524 8 | 273 6 | 75 -5 | 198 11 |
| 2020-21 | 1,230 -62 | 956 -63 | 462 -33 | 494 -30 | 274 1 | 75 0 | 199 1 |
| 2021-22 | 1,372 142 | 1,084 128 | 535 73 | 549 55 | 288 14 | 85 10 | 203 4 |
| 2022-23 | 1,358 -14 | 1,082 -2 | 532 -3 | 550 1 | 276 -12 | 84 -1 | 192 -11 |
| Average | 1,177 | 1,002 | 499 | 504 | 175 | 51 | 123 |