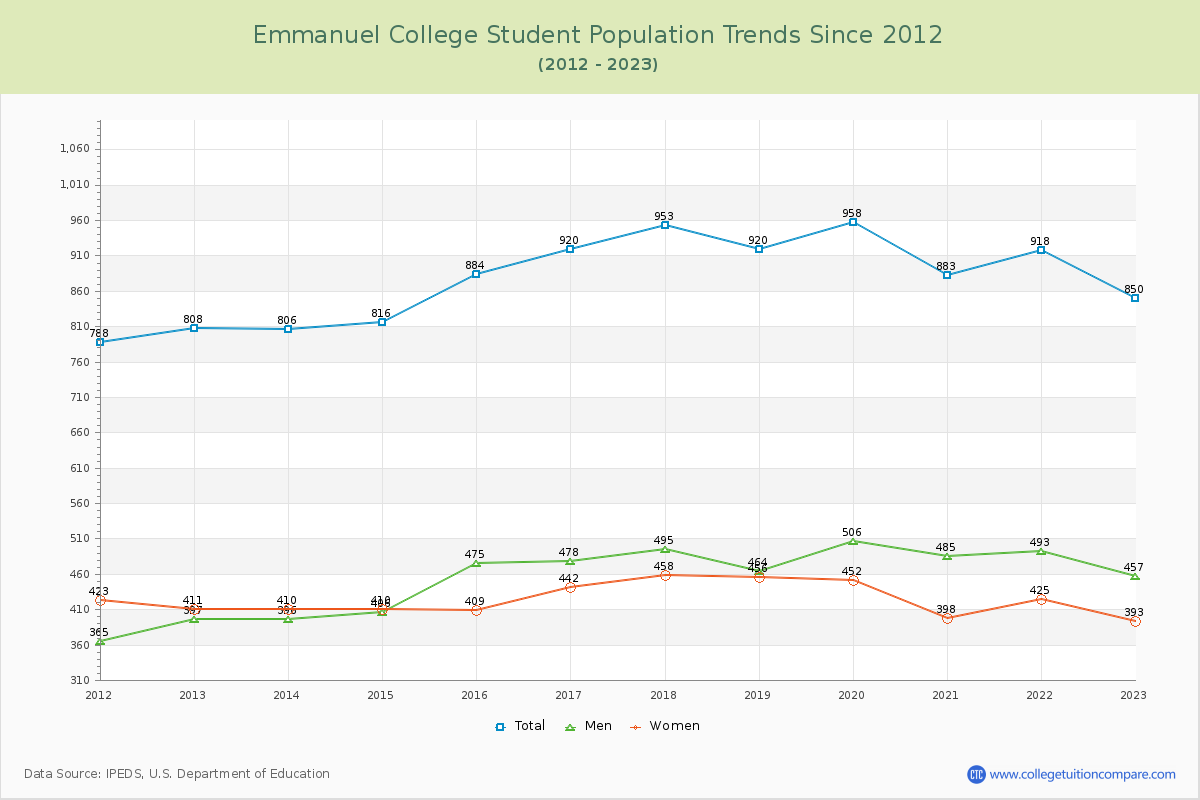
Student Population Changes
The average student population over the last 12 years is 883 where 850 students are attending the school for the academic year 2022-2023.
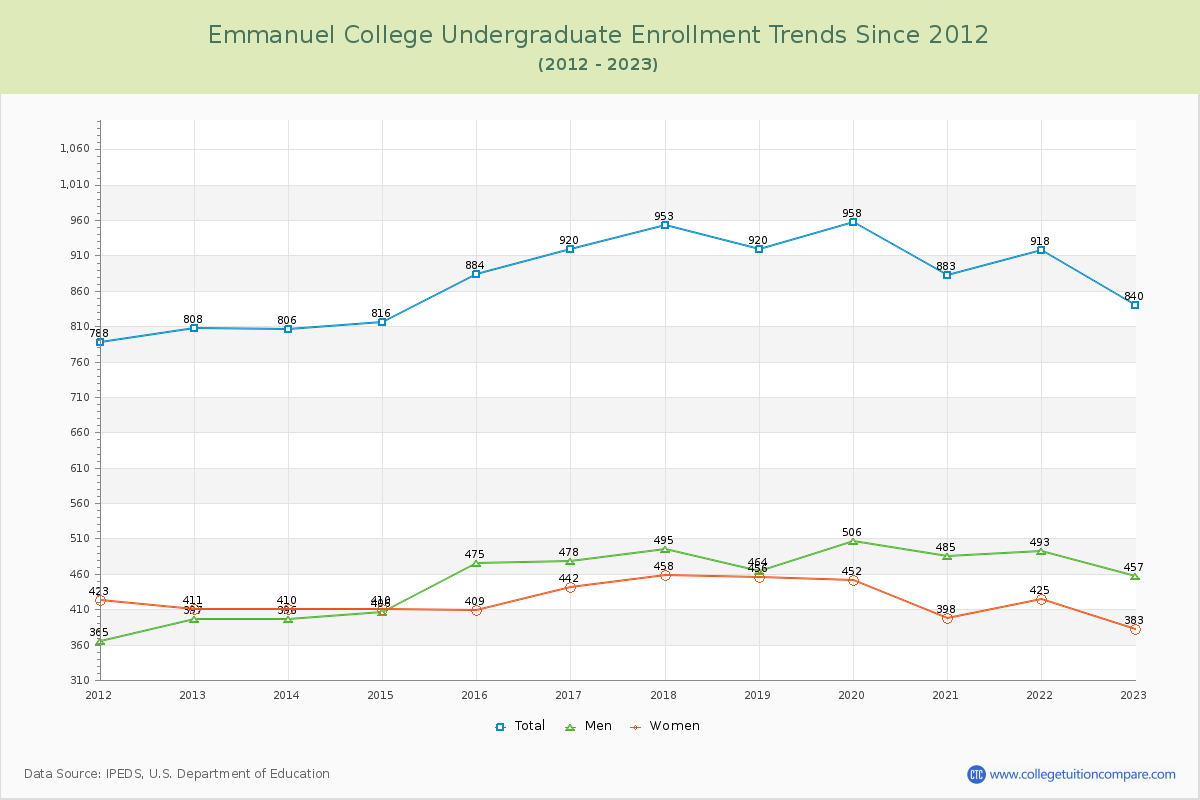
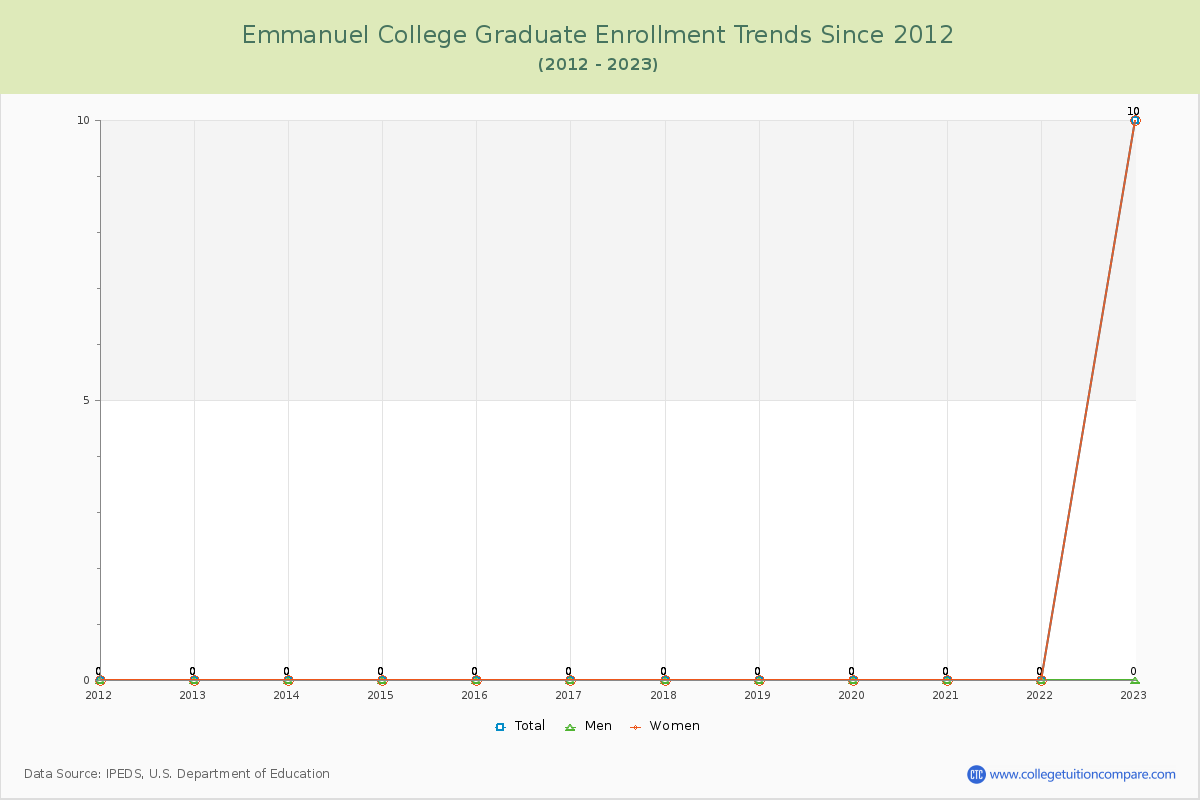
98.82% of total students is undergraduate students and 1.18% students is graduate students. The number of undergraduate students has increased by 32 and the graduate enrollment has increased by 10 over past 10 years.
The female to male ratio is 0.86 to 1 and it means that there are slightly more male students enrolled in Emmanuel than female students.
The following table and chart illustrate the changes in student population by gender at Emmanuel College since 2012.
| Year | Total | Undergraduate | Graduate | ||||
|---|---|---|---|---|---|---|---|
| Total | Men | Women | Total | Men | Women | ||
| 2012-13 | 808 | 808 | 397 | 411 | 0 | 0 | 0 |
| 2013-14 | 806 -2 | 806 -2 | 396 -1 | 410 -1 | 0 0 | 0 0 | 0 0 |
| 2014-15 | 816 10 | 816 10 | 406 10 | 410 0 | 0 0 | 0 0 | 0 0 |
| 2015-16 | 884 68 | 884 68 | 475 69 | 409 -1 | 0 0 | 0 0 | 0 0 |
| 2016-17 | 920 36 | 920 36 | 478 3 | 442 33 | 0 0 | 0 0 | 0 0 |
| 2017-18 | 953 33 | 953 33 | 495 17 | 458 16 | 0 0 | 0 0 | 0 0 |
| 2018-19 | 920 -33 | 920 -33 | 464 -31 | 456 -2 | 0 0 | 0 0 | 0 0 |
| 2019-20 | 958 38 | 958 38 | 506 42 | 452 -4 | 0 0 | 0 0 | 0 0 |
| 2020-21 | 883 -75 | 883 -75 | 485 -21 | 398 -54 | 0 0 | 0 0 | 0 0 |
| 2021-22 | 918 35 | 918 35 | 493 8 | 425 27 | 0 0 | 0 0 | 0 0 |
| 2022-23 | 850 -68 | 840 -78 | 457 -36 | 383 -42 | 10 10 | 0 0 | 10 10 |
| Average | 883 | 882 | 459 | 423 | 1 | 0 | 1 |